
True capacity is not seat count. It's seats multiplied by realistic turns, capped by whichever system runs out first: your dining room, your kitchen, or your managers. Calculate that number, then run three tests this week: rebalance your table mix to match party-size demand, track ticket times at the 90th percentile instead of the average, and stagger your reservation slots. Operators who make these changes typically see 15 to 30 percent more covers from the same footprint.
Do this in the next 48 to 72 hours:
- Pull party-size distribution and average dwell time from your POS and reservation logs for the last two weeks.
- Calculate current RevPASH (Revenue per Available Seat Hour) for lunch and dinner separately.
- Flag your kitchen's slowest 10% of tickets. That's your real bottleneck, not the average.
Covers rise even when the room itself doesn't get any bigger.
Key Takeaways
Restaurant capacity planning succeeds when table mix, turn calculations, and kitchen throughput are measured together and tested one change at a time.
| Point | Details |
|---|---|
| Calculate reliable capacity | Use seats × realistic turns, not theoretical seat count, as your true planning number. |
| Track RevPASH by daypart | Revenue ÷ (seats × hours open) reveals gaps averages hide. |
| Watch P90, not averages | Kitchen bottlenecks show up in the slowest 10% of tickets, not the median. |
| Match table mix to demand | Align 2-tops and 4-tops to actual party-size data before adding any seats. |
| Get a structured audit | Wits' End Solutions runs capacity audits and short live tests that turn these calculations into measurable RevPASH gains. |
Table of Contents
- What Restaurant Capacity Planning Actually Measures
- How to Calculate Seating Capacity Step by Step
- Why Your Kitchen Might Be Capping Your Dining Room
- Staffing and Manager Bandwidth Are Capacity Constraints Too
- Match Your Table Mix to Actual Party-Size Demand
- Tech and Process Levers That Move the Numbers Fastest
- A Simple Protocol to Test and Iterate on Capacity Changes
- How Wits' End Solutions Supports Capacity Planning Engagements
- Frequently Asked Questions
- Sources
What Restaurant Capacity Planning Actually Measures
Two numbers matter, and they're not the same thing. Theoretical capacity is the maximum number of seats your floor plan can physically hold. Reliable capacity (also called operational capacity) is what you can actually turn, service, and staff for on a normal Tuesday without falling apart. Most owners plan around the first number and get burned by the second.
Here's the core vocabulary:
- Seats: total fixed and flexible seating, counted separately (chairs at tables vs. bar stools vs. banquette bench space).
- Turns per service period: how many times a table is fully occupied and reset within a given window.
- Average dwell time: minutes from seating to check-close, tracked by party size.
- RevPASH: revenue ÷ (available seats × hours open). A $2,000 dinner service with 50 seats over 4 hours yields $10 RevPASH.
- Average check and utilization rate (percentage of seat-hours actually occupied) round out the set.
Pull four fields from your POS and reservation system: seating timestamp, departure timestamp, party size, and check total. Those four fields drive every calculation below.
How to Calculate Seating Capacity Step by Step
Start with the physical room, then layer in the operational reality.
- Measure your dining area in square feet, then separate fixed seating (booths, built-in tables) from flexible seating (movable tables, bar stools).
- Apply concept-appropriate density. Fine dining runs roughly 18 to 20 square feet per seat; casual dining sits around 15 to 18; fast casual and bar seating can go as low as 12 to 15 square feet per seat, according to seating-capacity benchmarks from KwickOS.
- Subtract for clearance. Aisles need roughly 36 inches minimum (44 inches for primary traffic paths), and chairs need pull-out and walk-behind space that eats into your raw square footage.
- Multiply seats by turns to get covers, then covers times average check to get revenue, then revenue divided by seat-hours to get RevPASH.
Worked example: 2,000 square feet ÷ 16 square feet per seat = 125 theoretical seats. If average dwell time is 75 minutes across a 4 hour dinner service, that's roughly 3.2 possible turns, but real-world resets and no-shows bring reliable turns closer to 2.2 to 2.5. At 2.3 turns, 125 seats, and a $42 average check, that's 287 covers and $12,054 in revenue, or about $24 RevPASH.
Record this data for 2 to 4 weeks before changing anything. A short baseline beats a gut-feel decision every time.
Why Your Kitchen Might Be Capping Your Dining Room
Adding tables doesn't help if the kitchen can't fire the extra tickets. Track ticket time as median and 90th percentile, plus tickets fired per hour per station.

Capture these timestamps: order placed, ticket fired to kitchen, first item up, and full table fired. Compute the gap between fired and fired complete for every ticket over a service, then rank them. The median tells you what a normal ticket looks like. The 90th percentile tells you what happens under pressure, which is exactly when a slow kitchen turns into a canceled reservation.
Common fixes that recover time without adding a single burner:
- Menu timing optimization: pull slow-cook items off peak-hour menus or pre-portion them earlier.
- KDS routing changes so tickets hit the right station in the right order.
- Dedicated plating stations during rush to stop expediting bottlenecks.
- Pre-batching sauces, proteins, or garnishes that spike prep time under load.
If the kitchen maxes out at P90, don't add seats: lengthen reservation slots or trim bookings during that window. If the dining room is the actual limiter (kitchen has slack, tables don't turn), that's a table-mix problem, not a kitchen one.
Pro Tip: Averages hide your worst nights. A kitchen with a 12-minute median ticket time can still have a 28-minute P90, and that 28 minutes is what triggers walkouts and bad reviews. Plan capacity around P90, not the average.
Staffing and Manager Bandwidth Are Capacity Constraints Too
Seats and stoves aren't the only ceiling. A manager who can only physically supervise two sections at once caps your usable capacity no matter how many tables you add.
Track these labor fields alongside your seating data:
- Covers per server per hour.
- Average table touches per turn.
- Labor hours per cover, by daypart.
- A manager-bandwidth ratio, meaning how many simultaneous sections one manager or shift lead can realistically run before service quality slips.
Scheduling tactics that protect that bandwidth: stagger server start times so the floor doesn't flood all at once, add a float position during peak turns to handle resets and drink runs, and never schedule your most experienced lead across two disconnected sections during a rush. Before adding seats or turns, test whether your current staffing model can even absorb the extra covers, because a great staff training program often unlocks more usable capacity than a new table ever will.
Match Your Table Mix to Actual Party-Size Demand
Pull party-size distribution straight from your reservation and walk-in logs, then compare it against your current table inventory. Most rooms are built around what looked good on opening day, not what guests actually book.
Cornell research on party-size alignment identifies data-driven table-mix matching as the single most effective lever for raising RevPASH and occupancy. Restaurants that right-size their table mix and add modular or banquette seating commonly see 15 to 25% more effective covers without touching the floor plan's footprint.
Nesting rules to apply:
- No nesting: seat every party at its exact-fit table. Simplest, but wastes seats when demand skews toward small parties.
- 1-up nesting: seat a 2-top party at a 4-top only when no 2-top is available and a larger party is not imminent.
- Full nesting: actively combine or split modular tables to match real-time demand, which MIT's revenue management research shows can raise expected revenue over strict first-come seating, provided wait times stay controlled.
Practical interventions: convert a few rigid 4-tops to modular 2-tops that combine on demand, add banquette seating for flexible party sizes, and treat bar seats as real dining covers during a wait, since bar seating uses less floor area per seat than a standard table.
Tech and Process Levers That Move the Numbers Fastest
Reservation system settings, POS timestamps, and your kitchen display system are the fastest levers to pull because none of them require construction.
- Reservation slot length and stagger: shorter, staggered slots reduce clustering that overwhelms the kitchen at :00 and :30.
- Waitlist and confirmation requirements: requiring confirmation for premium weekend slots cuts no-shows that quietly waste capacity.
- POS and KDS timestamps: clean, consistent timestamp capture is what makes every calculation above possible.
- Countdown timers on the floor plan: visual cues for table turn targets help servers and hosts self-correct in real time.
- Digital reservation tools: modern platforms give guests clearer expectations up front, which explains how digital reservations actually work and reduces friction that otherwise shows up as no-shows or late seatings.
Before running any test, confirm your timestamp and party-size fields are actually clean; a test built on messy data will lie to you.
A Simple Protocol to Test and Iterate on Capacity Changes
- Set a baseline window of 2 to 4 weeks, capturing RevPASH, average check, covers, P90 ticket time, and average wait, split by daypart.
- Run one intervention at a time (table mix, slot length, or a kitchen fix) for a matched window, ideally the same length as your baseline and covering equivalent days of the week.
- Compare before and after using a simple threshold: if RevPASH doesn't move at least 5 to 10% and covers didn't drop, the change probably isn't worth keeping.
- Prioritize your next test by impact times ease divided by risk. Table-mix changes are usually highest impact and lowest risk; kitchen line changes carry more risk but often the biggest upside.
Consultant note: where operators usually start
The blind spot we see most often is treating table mix and kitchen percentiles as separate problems when they're really one system. Three pitfalls repeat constantly: adding seats before fixing turns, judging kitchen speed by averages instead of P90, and scheduling managers across too many sections during the exact windows that need the most attention.
How Wits' End Solutions Supports Capacity Planning Engagements
Wits' End Solutions runs capacity audits the same way this article walks through them: baseline your current seats, turns, and kitchen percentiles, then design two or three targeted tests before touching a single wall. A typical engagement moves from a data audit into short live tests within weeks, not months, with our analytics and reporting tools tracking RevPASH and utilization throughout so you see the impact in real numbers, not guesses. Operators leave with a table-mix plan, a kitchen bottleneck diagnosis, and a staffing model built around your actual party-size demand instead of a generic template. If you're ready to see what your dining room is really capable of, start a conversation with Wits' End Solutions about a capacity audit for your property.
Frequently Asked Questions
What is a good RevPASH for a restaurant? RevPASH varies heavily by concept and check average, so compare your own number over time rather than chasing an industry figure. Track it by daypart and use week-over-week or test-over-test comparisons as your real benchmark.
How many turns should a table get per service? That depends entirely on average dwell time and service style. Calculate it directly: divide your service window in hours by average dwell time in hours to get a theoretical maximum, then expect your reliable number to land lower once resets and no-shows are factored in.
Does adding seats always increase revenue? Not if your kitchen or staffing can't support the extra covers. Adding seats without fixing the actual bottleneck, whether that's ticket times or manager bandwidth, just moves the wait time somewhere else.
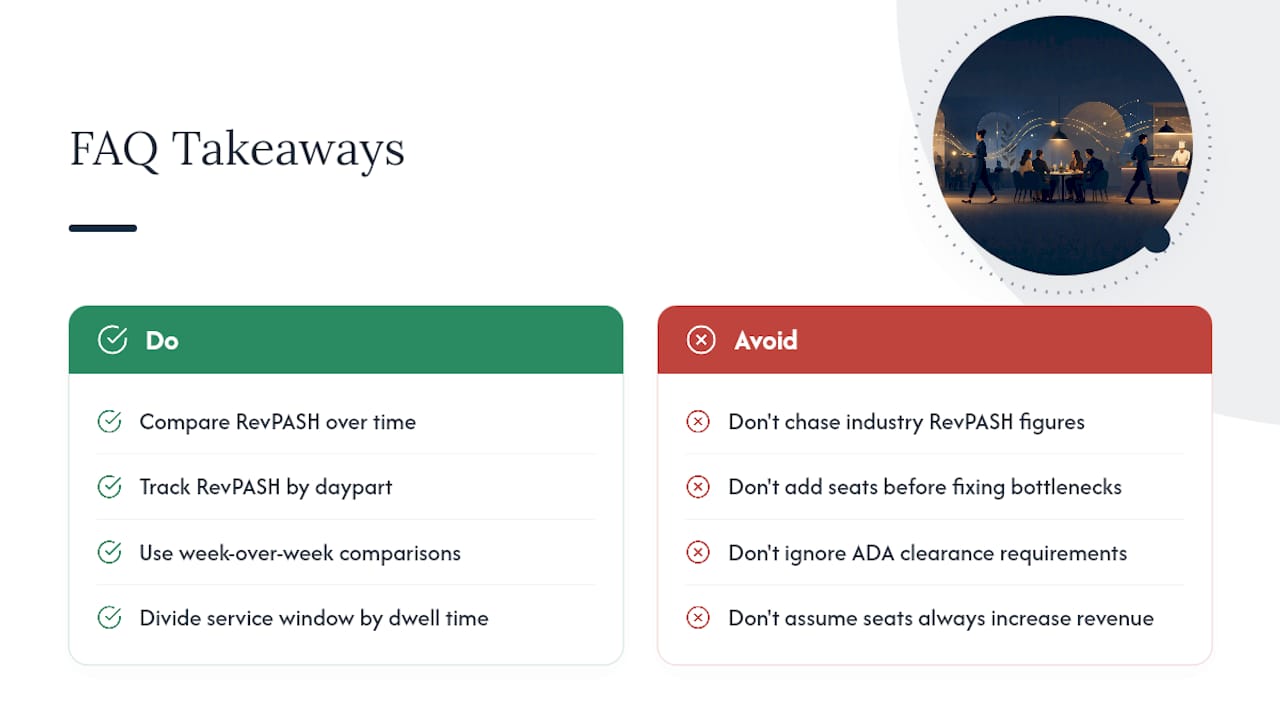
How does increasing capacity affect the guest experience? Tighter seating can raise noise levels and reduce comfort, and ADA clearance requirements set a hard floor on how tight tables can legally sit. Test any density increase against guest feedback and repeat-visit rates before locking it in permanently.
Sources
- Restaurant Revenue Management (MIT paper)
- Party-size alignment and RevPASH (Cornell eCommons)
- Restaurant Seating Capacity Calculator | KwickOS
- Restaurant Seating Capacity Optimization: More Covers, Same Space | RestaurantsTables
- Capacity planning | RestaurantBookingSystem Academy