
TL;DR:
- Food service analytics systematically uses data from various sources to enhance operational efficiency and profitability. It emphasizes tracking key metrics like prime cost and implementing routines to analyze data regularly and act on variances. Consistent discipline and targeted KPIs enable operators to make informed decisions and improve business performance.
Food service analytics is defined as the systematic process of gathering, processing, and analyzing data from POS systems, inventory, payroll, and customer feedback to drive decisions, reduce waste, and improve profitability. The industry term for this practice is "restaurant data analytics," though food service analytics covers the full spectrum of hospitality operations beyond standalone restaurants. Operators who build structured analytics in hospitality gain a measurable edge over those still running on instinct. Prime cost control, labor efficiency, and menu performance are the three pillars where data analysis in food service pays off fastest. This guide defines the concept, identifies the metrics that matter, and shows you how to put them to work.
What does "define food service analytics" actually mean for operators?
Food service analytics is the systematic process of collecting and analyzing internal and external data to generate insights that improve how a hospitality business runs. The data sources are specific: point-of-sale transactions, inventory counts, labor schedules, payroll records, and guest feedback. Each source answers a different operational question, and the power comes from reading them together rather than in isolation.

The concept is not new, but the tools available to operators today make it far more accessible than it was a decade ago. A restaurant group running five locations can now pull a unified view of food cost, labor hours, and cover counts across all sites in minutes. That kind of visibility used to require a full-time analyst or a very patient general manager with a spreadsheet habit.
The importance of food analytics becomes clear when you consider what operators are flying blind on without it. Gut feeling tells you Tuesday nights are slow. Data tells you Tuesday dinner covers are down 18% versus the prior quarter, your labor cost that shift runs 6 points above target, and your bar sales are the only thing keeping the shift profitable. Those are three different decisions waiting to happen.
Which key metrics and KPIs define successful food service analytics?
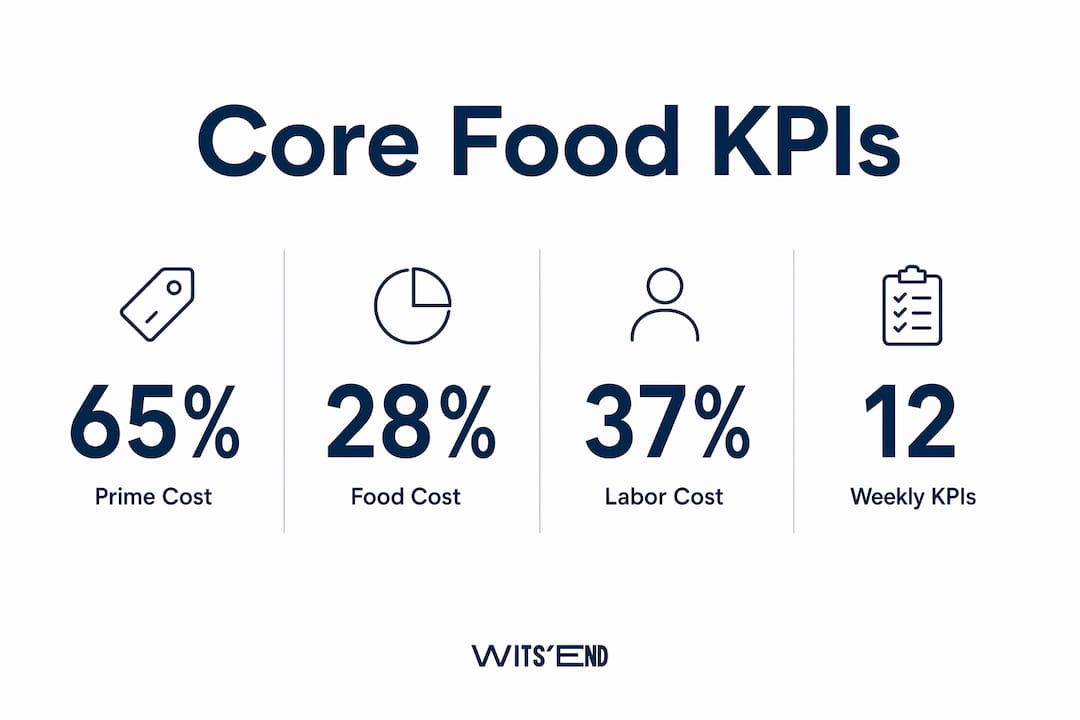
Prime cost is the most critical composite metric in food service, defined as the sum of food cost and labor cost. For full-service restaurants, the target sits around 60% of total sales. That single number tells you more about the health of your operation than almost any other figure on your P&L.
The core KPI set for weekly review
Operators should track approximately 12 KPIs on a weekly basis to maintain a clear picture of business health. Daily basics like total sales and food cost percentage keep you in the moment. Weekly reviews add depth. Quarterly deep-dives reveal trends and benchmark your performance against prior periods.
The 12 KPIs worth tracking weekly include:
- Food cost percentage: Cost of goods sold divided by total food revenue
- Labor cost percentage: Total labor spend divided by total revenue
- Prime cost: Food cost plus labor cost as a percentage of sales
- Sales per labor hour: Total revenue divided by hours worked
- Average check: Total revenue divided by number of covers
- Table turn rate: How many times a table is seated per service
- RevPASH: Revenue per available seat per hour, borrowed from hotel yield management
- Void and comp rate: Percentage of sales removed or discounted
- Inventory variance: Theoretical versus actual usage
- Delivery margin contribution: Net profit from third-party delivery after fees
- Guest satisfaction score: Aggregated from review platforms and internal surveys
- Cash flow from operations: Net cash generated by the business before financing
Pro Tip: Do not track all 12 metrics with equal urgency. Flag the three that are currently off-target and audit those first. Chasing every number simultaneously produces noise, not clarity.
KPI targets vary by concept
The right KPIs depend on your business concept. A quick-service restaurant targets a lower food cost percentage than a fine dining room because its menu is built on volume and speed. A pub balances food margins against drink margins, where the bar often carries the P&L. Applying a fine dining benchmark to a fast-casual operation will send you chasing the wrong problem.
| Concept | Food cost target | Labor cost target | Prime cost target |
|---|---|---|---|
| Quick service | 28%–32% | 25%–30% | 55%–60% |
| Fast casual | 28%–35% | 28%–33% | 58%–63% |
| Full service | 28%–35% | 30%–35% | 60%–65% |
| Fine dining | 30%–38% | 30%–35% | 62%–68% |
Note: These are industry reference ranges. Your specific targets depend on your menu, market, and lease structure.
How do hospitality operators implement data analysis in food service daily?
Structured review routines are the foundation of effective data analysis in food service. Without a fixed cadence, data sits in dashboards and generates no decisions. The review structure that works in practice follows three layers.
- Daily (10 minutes): Pull yesterday's sales, food cost flash, and labor hours. Compare against the same day last week. Flag anything more than 5% off target.
- Weekly (60–90 minutes): Review all 12 core KPIs. Identify the two or three metrics furthest from target. Assign a cause and a corrective action to each.
- Quarterly (half day): Run a full trend analysis. Compare this quarter to the prior quarter and the same quarter last year. Benchmark against your own targets, not industry averages you cannot verify.
The weekly review is where most operators underinvest. It feels like a lot of time until you realize it replaces three separate conversations with your chef, your floor manager, and your bookkeeper that were happening anyway, just without shared data.
Turning variance into a corrective audit
When a metric drifts, the data tells you where to look, not what to do. A food cost spike of 3 points in a single week points to one of four causes: a receiving error, a recipe portion drift, a theft issue, or a supplier price change. Effective analytics replaces the anecdote with a precise answer by isolating which category caused the variance. You then audit that category specifically rather than tightening controls across the board and creating friction everywhere.
Pro Tip: Build a one-page weekly scorecard that shows each KPI, its target, last week's actual, and the week-over-week change. Distribute it to your management team before the weekly meeting. The conversation becomes faster and more specific.
The role of food in hospitality extends well beyond the plate. Menu mix data, for example, shows which dishes are selling and which are dragging down your food cost. That information feeds directly into pricing decisions and recipe adjustments.
What technology supports food industry performance metrics at scale?
Data silos are the primary obstacle to effective analytics in hospitality. Your POS lives in one system, your inventory in another, your payroll in a third, and your guest reviews across five platforms. Copying data manually between these systems introduces errors and consumes labor hours that belong on the floor.
Data consolidation eliminates manual cross-system copying by automating source integration. The result is a single view of your operation that updates in near real time. The practical benefit is not just accuracy. It is speed. You see a labor spike on a Tuesday night before the shift ends, not when you reconcile payroll on Friday.
Analytics platforms in the hospitality space generally fall into two categories:
- Integrated POS reporting tools: Built into your existing POS, these cover sales, voids, and basic labor data. They work well for single-unit operators who need fast access to transactional data without a separate subscription.
- Dedicated analytics middleware: Standalone platforms that pull from multiple source systems and present a unified dashboard. These are built for multi-unit groups and operators who need cross-location visibility, anomaly detection, and trend analysis beyond what a POS report provides.
Analytics software can mimic the function of a multi-unit area director by flagging anomalies like food cost drifts or labor spikes automatically. That kind of automated oversight matters most for groups running more than three locations, where a single manager cannot physically be everywhere. The software surfaces the problem; your team resolves it.
What are the common pitfalls in adopting food service metrics?
Most operators who struggle with analytics share the same set of problems. Recognizing them early saves months of wasted effort.
- Relying on gut feeling over data routines. Instinct built from experience is valuable, but it cannot tell you that your Tuesday night labor cost is 8 points above target. Data can.
- Tracking too many metrics. A dashboard with 40 KPIs produces paralysis, not decisions. Start with prime cost, food cost percentage, and labor cost percentage. Add metrics only when you have the discipline to act on the ones you already track.
- Manual data handling. Copying numbers from one system to another by hand introduces errors and delays. A food cost figure that is two days old is not a management tool.
- Failing to translate data into decisions. Tracking KPIs consistently turns analytics from a reporting exercise into a management discipline only when each variance triggers a specific response.
- Using industry benchmarks as personal targets. A 30% food cost target published in a trade article was not written for your menu, your market, or your lease. Build your own targets from your own history.
Pro Tip: If your team cannot name the three metrics your operation is currently off-target on, your analytics practice is not yet functional. That is the test.
The customer service dimension of hospitality analytics is often underweighted. Guest satisfaction scores and complaint categories are data too. They tell you where service failures are costing you repeat visits, which is a revenue problem, not just a hospitality one.
Key Takeaways
Food service analytics works when operators track the right metrics on a fixed cadence and translate every variance into a specific corrective action.
| Point | Details |
|---|---|
| Define the right KPIs | Focus on prime cost, food cost percentage, and labor cost percentage before adding other metrics. |
| Match KPIs to your concept | QSR, full-service, and fine dining each carry different cost targets; apply benchmarks built for your model. |
| Build a review cadence | Daily sales checks, weekly 12-KPI reviews, and quarterly trend analysis create the discipline analytics requires. |
| Automate data consolidation | Middleware that pulls from POS, inventory, and payroll eliminates manual errors and surfaces problems faster. |
| Turn variance into audits | When a metric drifts, isolate the cause category and audit specifically rather than tightening controls everywhere. |
The number that changes everything
I have worked with operators who had beautiful dashboards and no idea what to do with them. The data was there. The discipline was not. What I have found, consistently, is that the operators who get the most out of analytics are not the ones with the most sophisticated tools. They are the ones who look at the same three numbers every single morning and ask the same question: why is this different from yesterday?
Prime cost is the number I always start with. If your food and labor costs together are running above 65% of sales, everything else on your P&L is fighting an uphill battle. That one metric tells you more about the structural health of your operation than a 20-line income statement. Once operators internalize that, the rest of the analytics practice tends to fall into place.
The other thing I push back on is the idea that analytics is a technology problem. The technology is the easy part. The hard part is building the management habit of acting on what the data shows, especially when it contradicts what you thought you knew. I have seen operators dismiss a clear food cost signal because their chef insisted the numbers were wrong. Three months later, the variance was still there. The data was right.
Analytics also extends your reach as an operator. If you run multiple locations, you cannot be everywhere. A well-configured dashboard acts like an area director who never sleeps. It flags the location where labor spiked on a Wednesday lunch, the one where voids jumped 2 points, and the one where average check dropped $4 in a single week. You respond to the signal, not the noise.
— Chris
How Wits' End Solutions approaches hospitality analytics
Wits' End Solutions works with hotel and restaurant operators across the United States to build analytics practices that actually produce decisions, not just reports. Our deep analytics and advising service consolidates your POS, inventory, payroll, and guest feedback into a single reporting layer, then helps your team build the review routines that turn data into margin. We have run these operations ourselves, which means we know which metrics move the needle and which ones just fill a dashboard. If your current reporting is not telling you where to act, we can help you fix that. Reach out to learn how we work with operators at every stage of the business.
FAQ
What is food service analytics?
Food service analytics is the systematic process of collecting and analyzing data from POS systems, inventory, labor, and customer feedback to improve operational decisions and profitability. It is also called restaurant data analytics in single-unit contexts.
What is prime cost and why does it matter?
Prime cost is the sum of food cost and labor cost, expressed as a percentage of total sales. For full-service restaurants, the target is around 60%; it is the most controllable composite metric on the P&L.
How often should operators review food service metrics?
Daily basics like sales and food cost should be checked every morning. A full review of approximately 12 KPIs should happen weekly, with a deeper trend analysis conducted each quarter.
What causes food cost variance in analytics reports?
Food cost variance typically traces to one of four causes: a receiving error, a recipe portion drift, a supplier price change, or theft. Analytics isolates which category is responsible so you can audit specifically rather than broadly.
Do all restaurants need the same KPIs?
No. The right KPIs depend on your concept. Quick-service restaurants target lower food cost percentages than fine dining rooms, and pubs balance food margins against drink margins. Applying the wrong benchmark to your concept produces misleading conclusions.