TL;DR:
- Hospitality business optimization involves integrating technology, mapping guest journeys, and using data-driven staffing to improve efficiency and guest satisfaction. Regular reviews and cross-departmental collaboration are essential to sustain improvements and boost revenue. Successful implementation depends on change management, ongoing training, and treating optimization as an operational discipline.
Hospitality business optimization steps are the practical actions hotel and restaurant managers take to improve operational efficiency, revenue performance, and guest satisfaction in a measurable, repeatable way. The industry term for this work is commercial and operational strategy integration, and it covers everything from your property management system to how your housekeeping team schedules its rounds. Done right, these steps compound. A better staffing model funds better service touchpoints. Better service drives repeat visits. Repeat visits protect your margin. This article breaks down exactly where to start, what tools you need, and how to avoid the mistakes that derail most optimization efforts before they produce results.
What are the core hospitality business optimization steps?
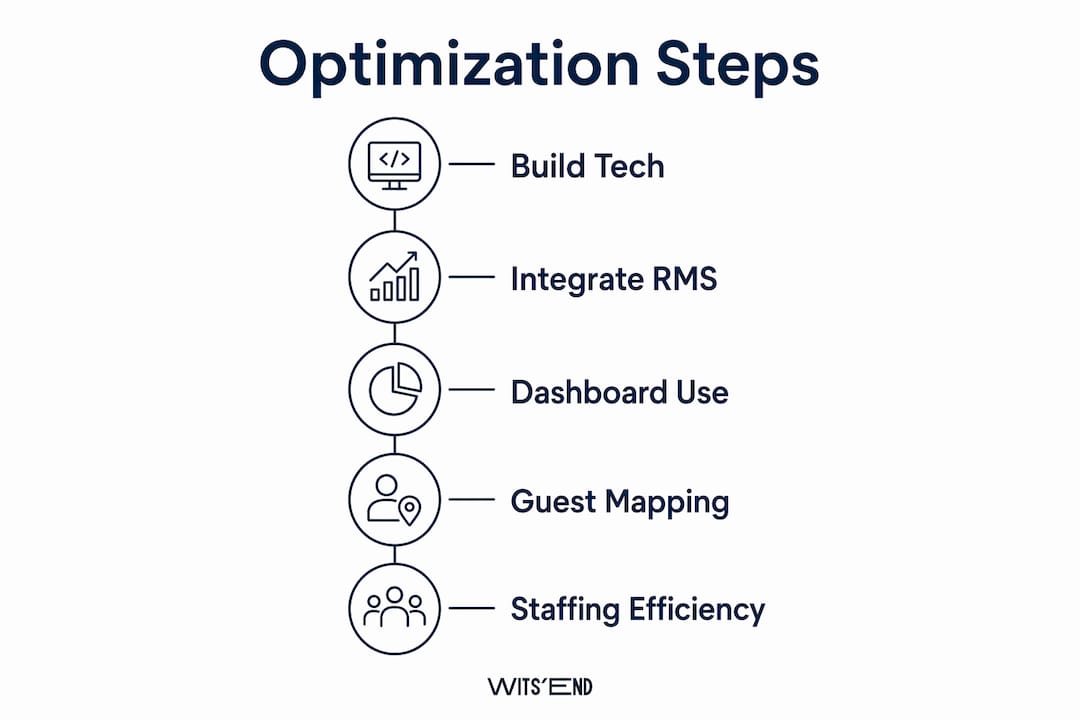
The foundational step is building the right technology stack before you try to optimize anything else. You cannot make good decisions about labor, pricing, or guest experience without reliable data flowing through connected systems. The three non-negotiable platforms are a cloud-based property management system (PMS), a channel manager, and a booking engine. These three tools form the operational backbone of any hotel or restaurant group running at scale.

Beyond the backbone, you need an integrated revenue management system (RMS) and a guest communication platform. The RMS handles dynamic pricing and distribution. The guest communication platform handles pre-arrival, in-stay, and post-stay touchpoints. Without both, you are leaving revenue and satisfaction scores on the table simultaneously.
Data dashboards tie everything together. A centralized dashboard pulling from your PMS, RMS, and CRM gives your team a single view of performance across departments. Without it, your revenue manager and your front office manager are working from different numbers.
| Tool | Primary Function | Optimization Impact |
|---|---|---|
| Cloud PMS (e.g., Opera Cloud, Cloudbeds) | Reservations, billing, reporting | Centralizes operational data |
| Channel Manager (e.g., SiteMinder) | Distribution across OTAs and direct | Reduces rate parity errors |
| Revenue Management System (e.g., IDeaS, Duetto) | Dynamic pricing and forecasting | Protects and grows RevPAR |
| Guest Communication Platform (e.g., Revinate, Medallia) | Pre, in, and post-stay messaging | Drives satisfaction and repeat visits |
| Centralized Dashboard | Cross-departmental KPI reporting | Aligns teams on shared goals |
The digital transformation timeline matters here. Moving from basic digitization to a true optimization phase takes 6–18 months. Set that expectation with your ownership group before you start.
How does guest journey mapping improve operational efficiency?
Guest journey mapping is the process of documenting every touchpoint a guest has with your property, from the first search query to the post-checkout review. It is one of the highest-return activities in hospitality management strategies because it reveals exactly where your operation is losing guests and why.
Hotels using guest journey maps boost satisfaction scores by 20–30% and increase repeat visits by 15% within one year. That result comes from quarterly reviews, departmental action plans, and integrated KPI monitoring. The map is not a one-time exercise. It is a living document that your team revisits every 90 days.
The components of an effective guest journey map include:
- Pre-arrival: Search and booking experience, confirmation communications, pre-arrival upsell offers
- Arrival: Check-in speed, first impression of the space, staff interaction quality
- In-stay: Room readiness, F&B experience, responsiveness to requests
- Departure: Checkout ease, final impression, loyalty program touchpoint
- Post-stay: Review solicitation, follow-up communication, re-engagement offers
The personalization gap is the biggest opportunity most properties miss. 71% of consumers expect personalization, and 76% are frustrated when it is absent. That frustration shows up directly in your review scores and your rebooking rate.
Pro Tip: When you run your quarterly journey map review, rank every identified gap by two criteria: guest impact and ease of implementation. Fix the high-impact, easy wins first. They produce visible results fast and build team momentum for the harder changes.
Which operational steps drive profitability without cutting service?
The most common mistake in cost reduction is cutting labor uniformly across all shifts and departments. That approach damages service quality and guest satisfaction in ways that take months to recover from. The better model uses real-time demand data to build dynamic staffing schedules.
Outdated static staffing creates direct inefficiency. The current best practice is updating labor schedules using real-time demand data refreshed at midday and midnight. This means your staffing levels on a Tuesday night actually reflect what is happening in your reservation system, not what happened last Tuesday.
Predictive housekeeping is the operational efficiency step most properties underuse. Zoning your property by occupancy density and sequencing room cleans by checkout time reduces labor hours without reducing cleanliness standards. Paired with a mobile housekeeping management tool, this approach cuts room-turn time and reduces overtime.
The reinvestment step is where most operators stop short. Lean operational savings should be reinvested at a rate of 20–25% back into visible guest service touchpoints. That means better amenities, faster response tools for your front desk, or staff training. Savings that disappear into the P&L without reinvestment erode morale and brand quality over time.
Common pitfalls to avoid when cutting operational costs:
- Reducing front desk staffing during peak check-in windows
- Eliminating F&B positions without adjusting menu complexity first
- Cutting training budgets during a technology rollout
- Applying uniform labor reductions across high-touch and back-of-house roles equally
Pro Tip: Before you cut any labor line, map that role against your guest journey touchpoints. If the position touches a guest-facing moment in the first or last 30 minutes of their stay, protect it.
How do you build an integrated commercial strategy?
Siloed operations are the most common cause of revenue underperformance in U.S. hotels. When your revenue manager, marketing director, and sales team are working from different data sets and different goals, you lose rate integrity, booking pace, and market share simultaneously. The fix is a unified commercial strategy with shared KPIs and a shared data environment.
The metrics that matter most in an integrated commercial strategy are TRevPAR (total revenue per available room), direct booking percentage, and cost of acquisition by channel. TRevPAR captures revenue across all departments, not just rooms. It gives you a complete picture of how each guest segment actually performs for your business.
Technology integration is the mechanism that makes this work. Your CRM, PMS, and RMS need to share data in real time. When a marketing campaign drives a spike in direct bookings, your revenue manager should see that signal and adjust pricing accordingly. When your sales team closes a group, your revenue manager should see the pickup and protect remaining transient inventory.
| KPI | What It Measures | Why It Matters |
|---|---|---|
| TRevPAR | Total revenue per available room | Captures full guest spend, not just room rate |
| Direct Booking % | Share of bookings from owned channels | Reduces OTA commission costs |
| Cost of Acquisition | Total cost to secure one booking | Reveals true channel profitability |
| GOPPAR | Gross operating profit per available room | Measures bottom-line operational health |
The commercial strategy integration model also requires a communication cadence. Weekly commercial meetings with revenue, marketing, and sales reviewing the same dashboard is the minimum standard. Monthly strategy sessions that adjust 90-day forecasts keep the team aligned as market conditions shift.
Pro Tip: Set a single shared dashboard as the required starting point for every commercial meeting. When everyone is looking at the same numbers, the conversation moves from debating data to making decisions.
Key takeaways
Effective hospitality business optimization requires connected technology, data-driven staffing, guest journey discipline, and a unified commercial strategy working together across every department.
| Point | Details |
|---|---|
| Build the right tech stack first | Connect your PMS, channel manager, RMS, and CRM before optimizing anything else. |
| Map and review the guest journey quarterly | Hotels using journey maps see 20–30% satisfaction gains and 15% more repeat visits. |
| Use real-time data for labor scheduling | Dynamic staffing updated at midday and midnight protects margins without cutting service. |
| Reinvest operational savings visibly | Put 20–25% of savings back into guest-facing touchpoints to protect loyalty and morale. |
| Unify your commercial strategy | Shared KPIs and real-time data across revenue, marketing, and sales drives direct booking growth. |
The optimization work that never actually ends
Here is what I have seen consistently across hotel and restaurant clients: the properties that treat optimization as a project eventually fall behind the ones that treat it as an operating discipline. You finish the PMS migration, you celebrate, and then six months later the team has drifted back to old habits because no one built the review cadence to sustain the gains.
The technology adoption failure rate is 60%, and the cause is almost never the technology itself. It is people. Frontline staff who were not involved in the rollout, managers who were not trained on the new dashboards, and ownership groups who approved the spend but not the change management budget. Allocating 10% of your tech spend to training is not optional. It is the difference between a tool your team uses and a tool that collects dust in your system.
I also want to push back on the idea that automation and hospitality are in tension. Automating routine tasks frees your staff to do the work that actually builds loyalty: remembering a guest's preferences, handling a complaint with genuine care, making someone feel like they are in the right place. The role of automation in hospitality is to remove friction, not to replace warmth. The properties that get this right use technology to create more space for human connection, not less.
The quarterly review rhythm is the single habit I recommend to every operator I work with. Review your guest journey map. Review your commercial KPIs. Review your labor model against actual demand. Four times a year, you have the chance to catch drift before it becomes a problem. Most operators only look up when something breaks.
— Chris
How wits' end solutions supports your optimization work
Wits' End Solutions works with hotel and restaurant operators across the U.S. to build and run the systems described in this article. From brand development and concept creation to deep analytics and advising powered by our Ingest partner platform, we cover the full range of what optimization actually requires. Our task force services put experienced operators on property when you need senior leadership in the building, not on a call. And our training programs are built specifically to close the adoption gap that kills most technology investments. If you are ready to move from planning to execution, we are ready to work alongside you.
FAQ
What are hospitality business optimization steps?
Hospitality business optimization steps are the specific operational, commercial, and technology actions that hotel and restaurant managers take to improve efficiency, revenue, and guest satisfaction. They include building a connected tech stack, mapping the guest journey, dynamic labor scheduling, and integrating revenue management with marketing and sales.
How long does hotel digital transformation take?
The optimization phase of digital transformation typically takes 6–18 months after initial digitization. Full transformation, including predictive analytics and AI-driven personalization, requires 18 or more months of sustained effort.
Why do most hotel technology rollouts fail?
Technology adoption fails 60% of the time due to poor change management, not technology problems. Involving frontline staff early and allocating at least 10% of tech spend to training are the two most effective ways to protect your investment.
What is TRevPAR and why does it matter?
TRevPAR measures total revenue per available room across all departments, including F&B, spa, and ancillary services. It gives a more complete picture of guest value than RevPAR alone and is the preferred KPI for integrated commercial strategy teams.
How often should you review your guest journey map?
Guest journey maps should be reviewed quarterly, with departmental action plans updated after each review. This cadence keeps the map current as guest behavior, technology, and competitive conditions change throughout the year.