
Inventory par levels are the fixed stock targets you top up to on every delivery day. Count what's on hand, subtract that from par, and order the gap. Two formulas cover almost every scenario you'll face: a weekly/deliveries formula for fast-moving items and a lead-time formula for slower, higher-cost supplies, both broken down with worked examples below.
TL;DR:
- Par levels are fixed stock targets set after scheduled deliveries, mainly for operations with predictable, recurring replenishment cycles.
- Using safety stock percentages between 10% and 30% helps prevent stockouts or overordering, especially when lead times or supplier reliability vary.
- Calculate par levels with the weekly formula for steady, fast-moving items or the lead-time formula for slow, high-cost supplies with unpredictable delivery schedules.
- Assign specific ownership for par sheet maintenance and review it regularly to account for menu changes, seasonal shifts, or supplier performance.
- Maintaining accurate, flexible par levels reduces waste, emergency orders, and cash flow blockages, supporting efficient inventory management.
Table of Contents
- What Are Inventory Par Levels, and How Do They Differ From a Reorder Point?
- Why Inventory Par Levels Matter for Cash Flow and Waste
- How Do You Calculate the Right Par Level?
- Worked Examples Across Restaurant, Bar, and Medical Inventory
- Best Practices for Setting and Maintaining Par Levels
- Setting Up a Par Sheet: Template and When to Go Digital
- What Wits' End Solutions Has Learned Running Par Systems On-Site
- When Par Alone Isn't Enough
- Get Your Par Levels Built Right the First Time
- Sources
- FAQ
What Are Inventory Par Levels, and How Do They Differ From a Reorder Point?
A par level is the quantity of an item you want on the shelf right after a delivery. "PAR" traces back to the phrase periodic automatic replenishment: a scheduled top-up model built for operations that receive deliveries on a fixed cadence, not for chasing every inventory dip in real time. Restaurants, bars, hotels, and healthcare facilities lean on par because staff count on a known day, place one order, and move on. This structure works because PAR assumes scheduled deliveries rather than continuous, on-demand restocking.
A reorder point (ROP) solves a different problem. Instead of a fixed schedule, ROP is a trigger: when stock falls to a specific quantity, you place an order regardless of the day. ROP suits items with irregular usage or suppliers who can deliver on short notice. Par suits items you count on a rhythm, usually because a delivery truck shows up whether you need it or not. Confusing the two is a common and costly mistake, since managers often blur PAR, ROP, and safety stock into one vague number,, which leads to either panic orders or shelves stuffed with product nobody needed yet.
A par sheet is the tool that makes this workable day to day. At minimum, it needs:
- Item name and unit of measure (case, pound, bottle, box)
- Par level (the target quantity after delivery)
- On-hand count (what's actually there on counting day)
- Order quantity (par minus on-hand, nothing more).
- Notes field for events, menu changes, or seasonal bumps
Keep the counting day consistent. A par sheet counted on a different day each week produces numbers nobody trusts, and untrusted numbers get overridden by gut instinct, which defeats the entire system.
Why Inventory Par Levels Matter for Cash Flow and Waste
Stockouts cost more than lost sales. They cost emergency delivery fees, substitute ingredients that break a recipe's food cost, and a line cook improvising during dinner rush because nobody caught the shortage on Tuesday. Par levels prevent that scramble by giving every item a known floor and ceiling, so ordering becomes a count and a subtraction instead of a guess.
The reverse problem, overordering, is just as expensive in a different way. Perishable inventory that sits past its useful life turns into waste, and waste is margin walking out the back door. Hospitality operators tend to feel this hardest on proteins, dairy, and produce, where a few days of overstock can mean an entire case gets tossed.
Well-run par systems deliver three concrete benefits:
- Fewer emergency orders and rush shipping fees
- Lower spoilage on perishables, which protects gross margin directly
- Clearer staff accountability, since the order quantity is a fixed calculation, not a judgment call
Pro Tip: Tie your par sheet to your P&L review. If a category's variance keeps drifting, the par number is probably stale, not the staff's counting.
There's also a cash flow angle that gets overlooked. Every dollar sitting in unused inventory is a dollar not available for payroll, rent, or a marketing push. Tight par levels, properly sized with safety stock, keep working capital where it's actually useful instead of parked on a shelf.
How Do You Calculate the Right Par Level?
Two formulas cover nearly every situation, and choosing between them comes down to how predictable your delivery schedule is.
Formula 1: Weekly/deliveries formula (fixed delivery schedule)
This is the primary formula for businesses with fixed delivery schedules:
PAR Level = (Average Usage per Period + Safety Stock) ÷ Deliveries per Period
Formula 2: Lead-time formula (variable schedules or longer lead times)
When deliveries aren't predictable, or when lead time stretches out, use the lead-time approach instead:
PAR Level = (Average Daily Usage × Lead Time) + Safety Stock
Safety stock is the buffer that absorbs a bad week: a slow supplier, a busy Saturday, a catering order nobody planned for. A widely used starting point in hospitality is 25% of average usage, though industry guidance suggests a working range of 10 to 30% depending on how reliable your supplier actually is. If a vendor misses fill rates or lead times swing unpredictably, push safety stock toward the higher end of that range rather than leaving it flat.
Here's the calculation broken into steps:
- Pull average usage over the period you're measuring (weekly usage for fast movers, daily usage for slow ones).
- Apply your safety stock percentage to that average.
- Add the two together.
- Divide by deliveries per period (formula 1) or multiply daily usage by lead time before adding safety stock (formula 2).
- Round to a sensible order unit, since you can't order half a case.
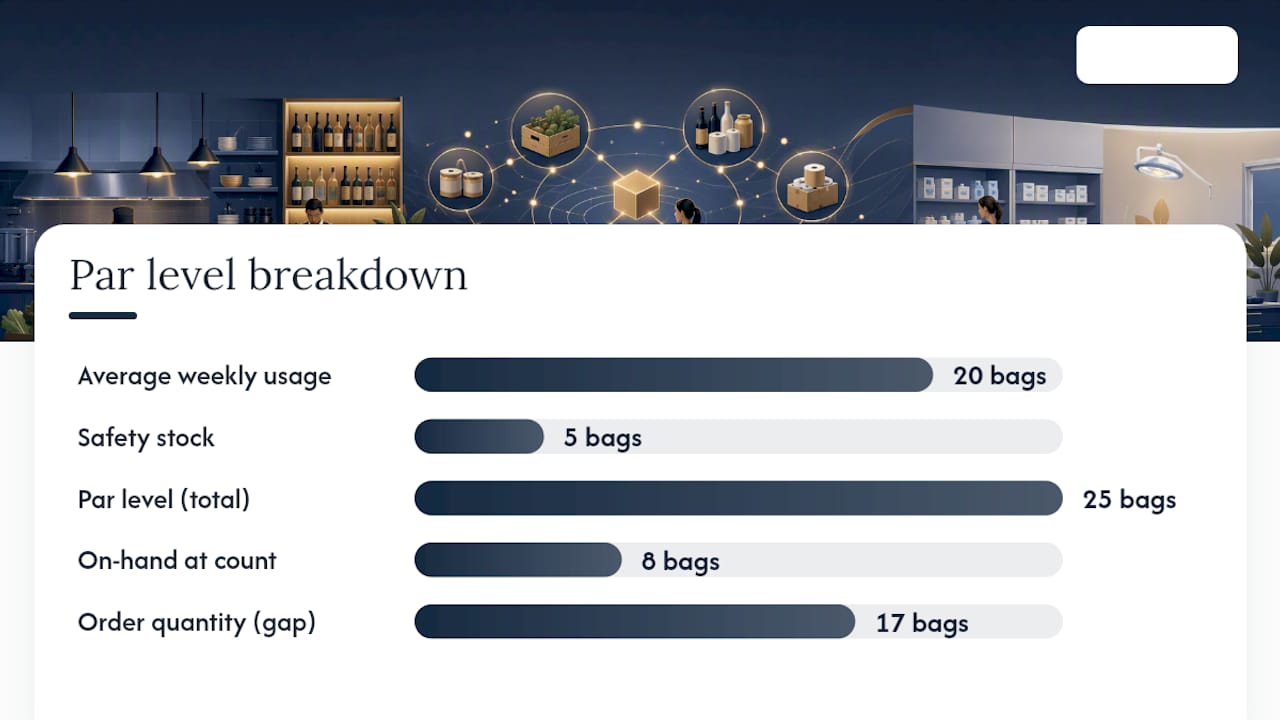
A worked example makes this concrete. Say a kitchen uses 20 bags of frozen chips a week, with one delivery per week and a 25% safety stock:
| Variable | Value |
|---|---|
| Average weekly usage | 20 bags |
| Safety stock (around 25%) | about five bags |
| Deliveries per week | typically one |
| Par level | (20 + 5) ÷ 1 = 25 bags |
| On-hand at count | 8 bags |
| Order quantity | 25 − 8 = 17 bags |
The order is never the par number itself. It's always the gap between par and what's physically on the shelf.
Worked Examples Across Restaurant, Bar, and Medical Inventory
The formula you pick should match how the item behaves, not just what category it falls into.
The par level consequently divides usage plus safety stock by deliveries per week. If on-hand sits at nine pounds when the delivery truck arrives, the order is the difference to par. Fast-moving, perishable items like this belong on the weekly formula because usage is steady and predictable enough to average cleanly.
The calculation sums usage and safety stock and divides by delivery frequency, rounding appropriately since suppliers rarely sell half units. Rounding direction matters here: round up on items where a stockout kills a menu item, round down on slow-moving specialty bottles where a few extra units tie up shelf space and cash.
Medical supply (lead-time formula). A clinic uses 6 boxes of a specialty wound dressing monthly, with a 10-day lead time and average daily usage of 0.2 boxes. Par = (0.2 × 10) + 1 (safety stock) = 3 boxes. This is exactly the case where slow-moving, expensive items benefit from the lead-time formula, since overstocking here means locking up real money in product that expires or gets superseded before it's used.
- Fast-moving, low-cost, perishable: weekly/deliveries formula
- Slow-moving, high-cost, long lead time: lead-time formula
- Irregular usage patterns: lean toward a higher safety stock percentage regardless of which formula you use
Pro Tip: When an item straddles both categories, calculate it both ways and use whichever number is higher. The cost of a slightly bigger par is almost always smaller than the cost of a stockout on a menu-critical item.
Best Practices for Setting and Maintaining Par Levels
Par levels only stay useful if someone owns them. Assign one person per category, usually the kitchen manager for food, the bar manager for liquor, and a supply coordinator for medical stock, so counts happen on a consistent day and nobody assumes someone else did it.
- Set ownership first. One accountable person per category, with a named backup for vacation coverage.
- Match review cadence to velocity. Fast-moving perishables need weekly review; slow-moving or high-cost items can go monthly or quarterly.
- Watch for adjustment triggers. A new menu item, a private event, a seasonal shift, or a supplier that starts missing fill rates should all prompt an immediate par review rather than waiting for the next scheduled check.
- Separate PAR, ROP, and safety stock explicitly. Label each on your sheet so purchasing staff never mistake one for another.
- Audit against actual usage quarterly. Par levels set six months ago rarely match today's demand.
Treating par as dynamic rather than fixed is the single biggest difference between operations that run tight and ones that constantly firefight. Industry guidance is consistent on this point: par should shift with seasonality, local events, and supplier reliability, not sit untouched on a spreadsheet from opening day.
Setting Up a Par Sheet: Template and When to Go Digital
A workable par sheet needs seven columns: item, unit, par, on-hand, order quantity, extra par (for known events), and notes. The order is always calculated as par minus on-hand, never entered as a flat number, so anyone covering the count gets the same answer a trained manager would.
The extra-par column matters more than most managers realize. A wedding block, a holiday weekend, or a local event that doubles foot traffic all call for a temporary bump above standard par, documented right on the sheet so it doesn't get mistaken for a permanent change.
A spreadsheet works fine for a single restaurant with a handful of vendors and a manager who counts consistently. The math is simple, the template is reusable, and it costs nothing beyond setup time. Once you're running multiple properties, juggling dozens of SKUs across departments, or need real-time visibility into on-hand counts between physical counts, integrated inventory software starts paying for itself in reduced admin time and fewer sheet-to-sheet inconsistencies. The trigger point is usually scale and speed, not sophistication for its own sake.
What Wits' End Solutions Has Learned Running Par Systems On-Site
During openings and turnarounds, Wits' End Solutions assigns par ownership before the first delivery ever arrives, because a system without a named owner drifts within weeks. We typically run a short yield-test window before finalizing any par number, measuring actual usage against theoretical usage so the par reflects real kitchen or bar behavior rather than a vendor's suggested case size.
Par should also be sized against dollar-variance exposure, not just unit count. A $4 case of napkins and a $180 case of aged ribeye both might have a par of "one case," but the financial risk of getting either one wrong is nowhere close to equal, and your safety stock decisions should reflect that gap.
Pro Tip: Run your yield test during a normal week, not a holiday week. A par level calculated off an outlier period will be wrong every single week that follows it.
For operations juggling par timing against table turns and staffing patterns, capacity planning work often surfaces the same seasonality signals that should be driving your par reviews.
When Par Alone Isn't Enough
Par levels work best for operations with genuinely scheduled deliveries and reasonably steady demand: a neighborhood restaurant, a hotel F&B outlet, a clinic ordering standard supplies. Once demand swings hard week to week, a single fixed number starts missing in both directions, too high some weeks, too low others.
That's the point to introduce a hybrid approach, layering a reorder point on top of your highest-variability items while keeping par for everything predictable. Moving toward continuous review makes sense once you have the data volume to justify it. Until then, a well-tuned par system with honest safety stock beats a complicated system nobody maintains.
— Chris
Get Your Par Levels Built Right the First Time
A spreadsheet template gets you started, but getting the numbers right, and keeping them right through menu changes, seasonal swings, and supplier hiccups, is where most operations lose the thread. Wits' End Solutions builds par sheets and runs the yield testing behind them as part of our brand and operations engagements, so the numbers reflect your actual kitchen or bar, not a generic vendor estimate. For properties in the middle of an opening or a turnaround, our task force engagements can get par systems live and staff trained within the first weeks of operation. Once par is stable, our analytics and reporting work keeps variance visible so drift gets caught before it shows up on the P&L. If you're rebuilding inventory controls from scratch or just tired of guessing, Reach out to a hospitality consulting firm to scope a short engagement built around your actual delivery schedule and item mix.
Sources
FAQ
What Does PAR Stand For in Inventory?
PAR stands for periodic automatic replenishment, referring to a fixed stock target you restock to on a scheduled delivery day rather than a continuous trigger point.
What Is the Formula for Calculating Par Level?
The standard formula is PAR Level = (Average Usage per Period + Safety Stock) ÷ Deliveries per Period for fixed schedules, or (Average Daily Usage × Lead Time) + Safety Stock when deliveries or lead times vary.
What Is the 80/20 Rule in Inventory?
The 80/20 rule, or Pareto principle, holds that roughly 20% of your inventory items typically drive around 80% of usage or value, which is why fast-moving items deserve tighter, more frequent par reviews than slow movers.
What Is EOQ and ROP, and How Do They Relate to Par?
Economic order quantity (EOQ) calculates the ideal order size to minimize ordering and holding costs, while reorder point (ROP) is the stock level that triggers a new order. Par level differs from both by setting a fixed top-up target for scheduled deliveries instead of a cost-optimized quantity or a continuous trigger.
How Often Should Par Levels Be Reviewed?
Review fast-moving, perishable items weekly and slower, higher-cost items monthly or quarterly, adjusting sooner whenever a menu change, event, or supplier issue shifts actual demand.