
Beverage cost percentage is beverage COGS divided by beverage sales, multiplied by 100. Most healthy bar and restaurant programs land in a blended range around the industry benchmark for beverage cost percentage, though the right number depends heavily on your mix of spirits, beer, wine, and non-alcoholic drinks. A beverage cost percentage drifting above typical healthy levels usually points to multiple underlying issues and requires a comprehensive diagnostic approach, rather than a single quick fix.
TL;DR:
- Most healthy beverage cost percentages range from 20% to 30%, but the optimal number varies based on the mix of spirits, wine, beer, and non-alcoholic drinks.
- Accurate calculation depends on matching period-specific inventory, purchases, and revenue data, avoiding mixing weekly and monthly figures or counting comps and spillages as revenue.
- Draft beer often appears with a high cost percentage due to line loss and foam, despite potentially good pouring discipline, which can mask true margins.
- Weekly inventory counts and standardized pouring practices are the most effective operational tactics for controlling beverage cost percentage over time.
- Systematic review, including verifying data accuracy and adjusting recipe and pricing strategies, is essential to address systemic cost issues, especially when costs drift above target levels.
Table of Contents
- How Do You Calculate Beverage Cost Percentage?
- What Are Normal Beverage Cost Ranges by Category?
- Pour Cost vs. Beverage Cost: What's the Difference?
- What Operational Tactics Lower Beverage Cost Percentage?
- How Often Should You Track Beverage Cost KPIs?
- How Often Should You Count Beverage Inventory?
- Why Does Beverage Cost Percentage Matter to Overall Profitability?
- What Mistakes Do Operators Make Calculating This Number?
- How Wits' End Solutions Diagnoses Beverage Cost Problems
- Get Help Diagnosing Your Beverage Cost Program
- Sources
- FAQ
How Do You Calculate Beverage Cost Percentage?
The formula is simple, but the inputs trip up more operators than the math does. You need three numbers: beginning inventory, purchases, and ending inventory, all for the same beverage category and the same time period.
Beginning inventory is your ending count from the prior period, pulled from your last physical count, not a system estimate. Purchases come from vendor invoices dated inside the period you're measuring. Ending inventory requires a fresh physical count on the last day of the period.
- Add beginning inventory to purchases.
- Subtract ending inventory. That result is your beverage COGS.
- Divide beverage COGS by beverage revenue from your POS for the identical period.
- Multiply by 100 to get your percentage.
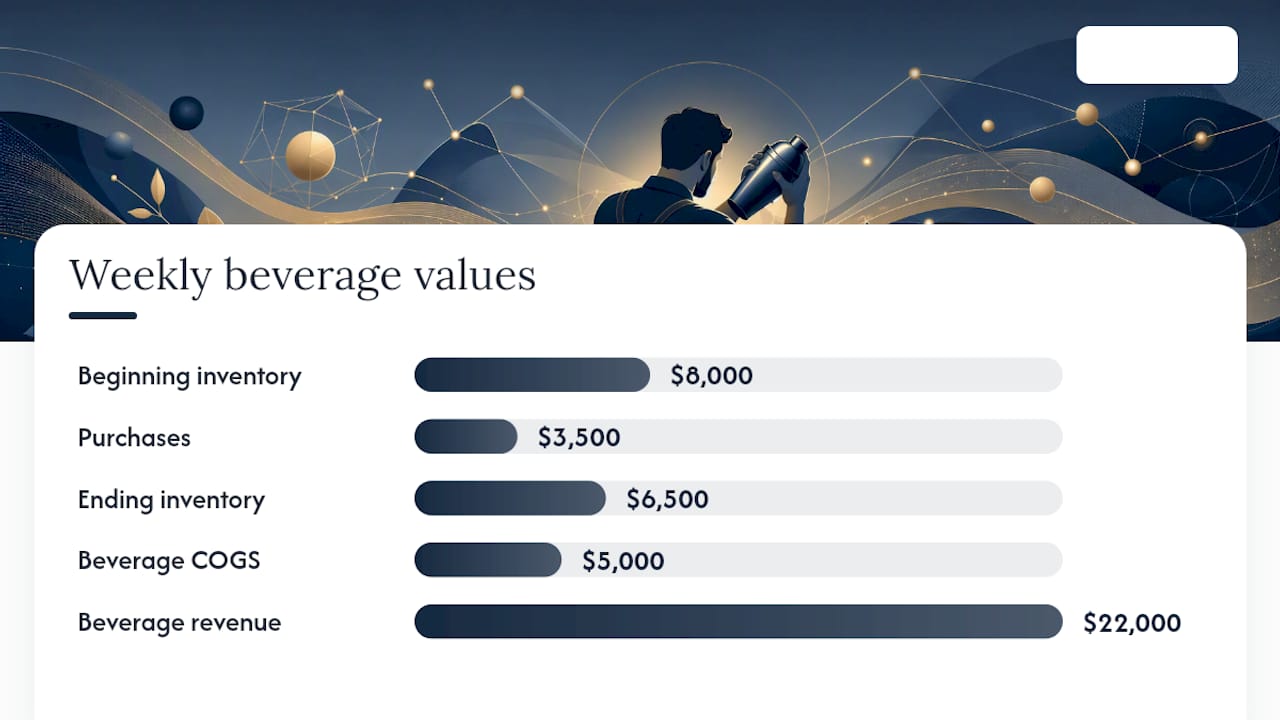
The formula looks like this in practice: a bar starts the week with $8,000 in beverage inventory, buys $3,500 more from distributors, and ends the week with $6,500 on the shelf. That's $8,000 plus $3,500 minus $6,500, or $5,000 in COGS. If beverage revenue for that same week hit $22,000, the beverage cost percentage is $5,000 divided by $22,000, times 100. That's 22.7%, comfortably inside a healthy blended band.
Three mistakes wreck this calculation more than any others: mixing a weekly inventory count with a monthly revenue figure, counting comped or spilled drinks as revenue when they generated none, and using POS "rung" sales instead of actual deposited sales when the two diverge because of discounts or voids.
What Are Normal Beverage Cost Ranges by Category?
A single target number hides more than it reveals. Spirits behave nothing like wine on a P&L, and lumping them together into one blended figure is one of the more common errors operators make when setting cost targets.
| Category | Typical cost range | Why it lands there |
|---|---|---|
| Spirits and cocktails | 22% to 24% | High markup per ounce, low waste, long shelf life |
| Draft beer | 20% to 28% | Line loss, foam, and keg yield variance eat into margin |
| Bottled beer | 20% to 28% | Predictable pour, but lower markup than spirits |
| Wine | 28% to 30% | Bottle spoilage, glass pour variance, higher unit cost |
| Non-alcoholic | 12% to 20% | Cheap inputs, but easy to underprice on the menu |
Draft beer deserves a second look before you trust the number on paper. A high-velocity draft program can post a strong cost percentage while still hiding sloppy pour discipline, because optimistic keg yield estimates paper over the line loss and foam that eat real product.
To build your blended target, weight each category's benchmark by its share of total beverage revenue. A wine-heavy dining room lands closer to 26% blended; a cocktail-forward bar lands closer to 20%.
Pour Cost vs. Beverage Cost: What's the Difference?
Pour cost measures a single recipe. Beverage cost measures your entire program. They answer different questions, and confusing them leads to bad pricing decisions.
Pour cost is calculated per drink: ingredient cost divided by the drink's menu price, times 100. A margarita costing $1.40 in tequila, triple sec, and lime, sold at $12, has a pour cost of 11.7%. Garnishes, bitters, and mixers belong in that math too, since omitting them from recipe costing skews the number low and often masks an underpriced menu item.
Beverage cost is the program-wide rollup. Consistent pour cost discipline across every recipe is what drives the overall program's beverage cost down over time. Use pour cost when building or revising a menu. Use beverage cost percentage when reviewing the monthly P&L.
What Operational Tactics Lower Beverage Cost Percentage?
Fixing a high beverage cost percentage rarely comes down to one lever. The most reliable tactics work together, and they're worth tackling in order of speed to impact.
- Move to weekly inventory counts. Monthly counts let variance compound for weeks before anyone notices; weekly counts catch a spike while it's still small enough to trace.
- Standardize pours and recipes. Jiggers, standardized recipe cards, and measured pour spouts remove guesswork, and holding staff accountable to those standards protects margin every shift.
- Reengineer the menu. Reprice and reposition items using category benchmarks rather than gut feel, and push high-margin items into better menu real estate.
- Tighten comp and cash controls. Every comped drink needs a manager code and a reason logged in the POS; unlogged comps are the easiest place for cost to leak unnoticed.
- Renegotiate with vendors and audit invoices. Line-check every delivery against the invoice before it's paid, and revisit pricing with distributors at least annually.
Pro Tip: Batch-prepping high-volume, non-alcoholic drinks like batch-brewed coffee or house sodas cuts labor and waste at once, and it's one of the fastest wins in a program that's never applied portion discipline to its non-alcoholic menu.
How Often Should You Track Beverage Cost KPIs?
Weekly inventory counts, daily POS spot checks, and a monthly P&L reconciliation form the backbone of a reporting cadence that actually catches problems before they cost you real money.
- Beverage cost percentage: calculate weekly per category, not just monthly blended.
- Pour cost by recipe: recheck any time a vendor price or recipe changes.
- Inventory variance: the dollar gap between what your POS says should be on hand and what your count actually finds.
- Comps rate: comped beverage dollars as a percentage of total beverage revenue.
When beverage cost spikes without warning, work through a short checklist: confirm the inventory count itself wasn't the error, check pour discipline on the floor, verify every POS button maps to the correct recipe and price, and call your distributor to rule out an unnoticed price increase.
How Often Should You Count Beverage Inventory?
Weekly counts are the standard recommendation for any bar or restaurant serious about controlling cost, and for good reason: beverage cost is most actionable when tracked on a weekly cycle rather than left to a single month-end snapshot.
A monthly-only count still has its place for high-turnover categories like well spirits, but it hides too much for anything with real waste risk, draft beer especially. By the time a monthly count flags a problem, four weeks of line loss, over-pouring, or shrinkage have already happened, and you've lost the paper trail needed to figure out why.
Track inventory by category, not just as one blended beverage number. Spirits, wine, and beer each move differently, and a blended figure can mask a wine problem sitting underneath a strong spirits number. Log dollar variance (not just unit counts) between what your POS predicts should be on hand and what your physical count finds, since dollar variance surfaces high-cost problems faster than a raw bottle count does.
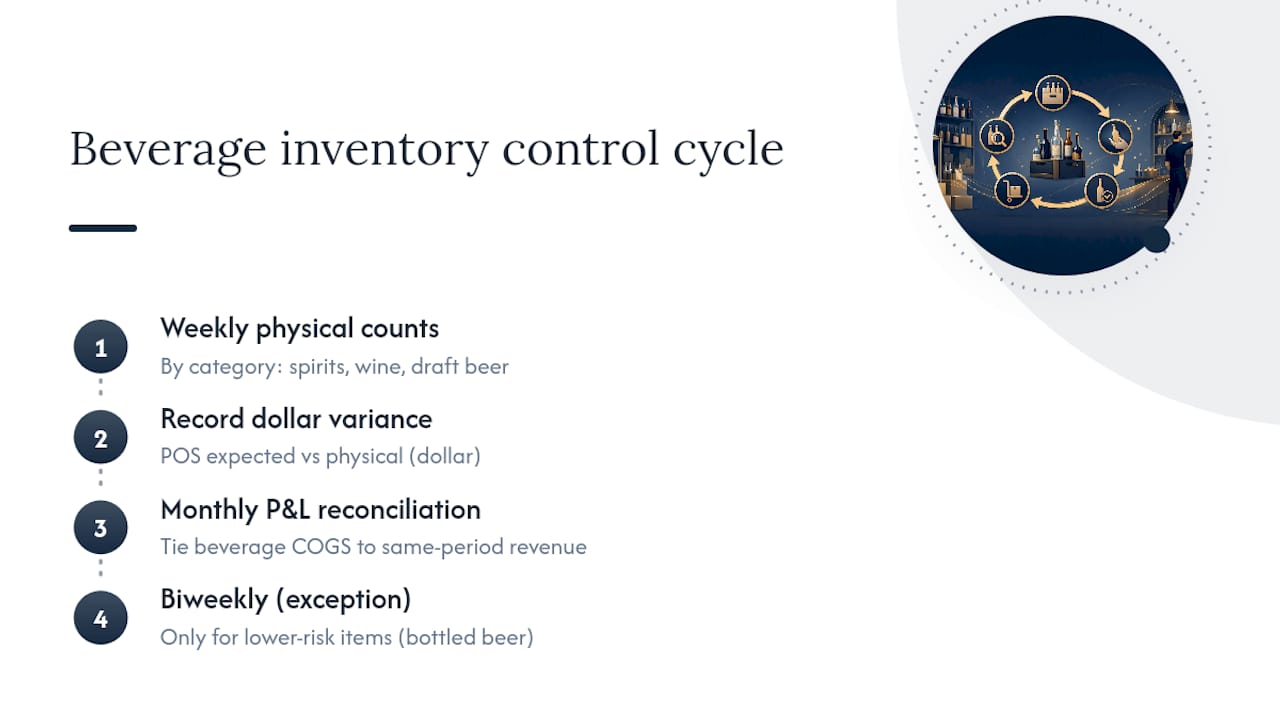
Pair the weekly count with a monthly P&L reconciliation that ties beverage COGS back to actual revenue for the same period. That reconciliation is where mismatched dates, missed invoices, or comp errors usually surface. Smaller operations sometimes stretch to a biweekly count for lower-risk categories like bottled beer, but wine and draft beer rarely tolerate that gap without cost drift creeping in unnoticed. If your team is already using inventory management built around dollar variance rather than raw unit counts, the weekly cadence becomes far less of a burden to maintain.
Why Does Beverage Cost Percentage Matter to Overall Profitability?
Beverage cost percentage isn't an isolated bar metric. It's one of the highest-margin levers on the entire P&L, because beverages typically carry lower cost percentages than food, which means every point you shave off beverage cost drops more directly to the bottom line than the equivalent point on a food cost line.
A restaurant running 30% food cost and 24% beverage cost, at a 70/30 sales split between food and beverage, carries a blended cost of goods sold around 28.2%. Shift that beverage number down to 20% and the blended figure drops to roughly 27%, a meaningful swing in gross margin without touching a single food price. That's the leverage beverage programs offer: smaller category, outsized margin impact.
Pricing strategy has to work in both directions. It's only a problem if your overall menu pricing architecture doesn't account for it elsewhere, whether through higher-margin cocktails, better beer pricing, or food items priced to compensate. Menu engineering means treating cost percentage as one input into pricing, not the only one; a drink priced purely to hit a cost target while ignoring guest perception of value will underperform even at a great percentage. The goal is a beverage program that supports the overall restaurant's profit picture, not one optimized in isolation from food, labor, and rent.
What Mistakes Do Operators Make Calculating This Number?
The most damaging error is treating one blended target as gospel across every category, which papers over a wine problem sitting under a strong spirits number, or a draft beer program masking poor pour discipline behind high-velocity sales.
The second most common mistake is inconsistent period matching: counting inventory on Sunday but pulling revenue numbers through Monday, or running a "weekly" count that's actually eight or nine days apart depending on staff schedules. Even small period mismatches compound into a beverage cost percentage that doesn't reflect reality.
Third, plenty of programs omit comps, spillage, and training pours from the accounting entirely, which inflates apparent revenue efficiency while actual product walks out the door unaccounted for. And fourth, recipe costing that leaves out garnishes, mixers, and bitters consistently understates true pour cost, which means the "good" cost percentage on paper doesn't match what's actually happening at the bar.
How Wits' End Solutions Diagnoses Beverage Cost Problems
We start every beverage cost engagement the same way: verify the data before touching the operation. That means confirming inventory counts are accurate, checking pour discipline against recipe standards on the floor, and mapping every POS button to the correct price and category before drawing conclusions from a single number.
Operators who go through that remediation process typically see measurable gains, tighter category variance within a few inventory cycles and real margin recovery once pricing architecture catches up to actual cost. Not every fix needs outside help. A team with disciplined weekly counts and clear recipe standards can often correct drift on its own. Consultants earn their keep when the cost problem is systemic, spans multiple locations, or has resisted internal fixes for more than a cycle or two.
— Chris
Get Help Diagnosing Your Beverage Cost Program
Wits' End Solutions gives you a faster path to a fixed number than trial-and-error internal audits, because our deep analytics and advisory work is built specifically to trace cost variance back to its root cause, whether that's inventory integrity, pour discipline, or a pricing architecture that never caught up to your actual costs. We've built beverage programs, run them, and fixed them when they drifted, so we know which of the five tactics above to prioritize for your specific mix of spirits, beer, and wine.
If your beverage cost has crept above your target and stayed there for more than a cycle or two, that's the point to bring in outside eyes. Start with a discovery call to walk through your current numbers, and consider whether this is a fix your team can run internally or one that needs outside support. Reach out to Wits' End Solutions to get that conversation started.
Sources
- Bar Beverage Cost: COGS Formula & Fixes | BarGuard
- Bar pour cost and beverage margin | Tableview
- Pour cost calculator
FAQ
How Do You Calculate Beverage Cost?
Add beginning inventory to purchases, subtract ending inventory to get beverage COGS, then divide that figure by beverage revenue and multiply by 100.
Is Pour Cost the Same as Beverage Cost Percentage?
No. Pour cost measures a single recipe's cost against its menu price, while beverage cost percentage measures your entire beverage program's cost against total beverage revenue over a period.