
The highest-leverage menu development strategies are menu engineering, price presentation, design-led merchandising, selective simplification, and rapid testing through limited-time offers. Each one works because it targets a different lever: what you sell, what you charge, how you present it, how many choices you offer, and how fast you learn from real orders. Here are the examples of menu development strategies we deploy most often with clients, and the one-line action you can take on each today.
- Menu engineering: Pull 90 days of POS data and plot every item by units sold against contribution margin.
- Price presentation: Strip currency symbols from your printed menu and re-test average order value.
- Design-led merchandising: Move your two highest-margin dishes into the top-right of the first page.
- Selective simplification: Cut any category with more than seven items down by removing the two worst performers.
- LTO testing: Launch one limited-time item this month with a hard four-week rollback date.
- Dayparting: Build a condensed menu for your slowest two hours instead of running the full book all day.
- Cross-utilization sourcing: Identify one protein or sauce you can use in three different dishes.
- Recipe costing and portion control: Rebuild cost cards for your top ten sellers using current invoice prices.
- Digital analytics: Set a recurring 15-minute weekly review of item-level sales and voids.
- Trend integration: Add one plant-based or beverage item that shares ingredients with your existing prep.
Before touching any of these, pull twelve weeks of item-level sales data as your baseline. Without it, you're guessing, and guessing is expensive in a kitchen.
Key Takeaways
Profit-first menu development combines data-driven engineering, deliberate pricing presentation, selective design, and short test cycles to lift margin without alienating guests.
| Point | Details |
|---|---|
| Pull 12 weeks of data first | Never redesign or reprice a menu without an item-level sales baseline of at least 12 weeks. |
| Build category-level matrices | Classify items as Stars, Puzzles, plow horses, or Dogs within each category, not menu wide. |
| Test one variable at a time | Run LTOs and price presentation changes as isolated tests with clear rollback criteria. |
| Target 5 to 7 items per category | Trim bloated categories to improve execution speed and reduce guest decision fatigue. |
| Partner with Wits' End Solutions | Wits' End Solutions builds profit-first menu audits, recipe costing, and analytics support for operators who want expert execution without building the process alone. |
Table of Contents
- What Are Examples of Menu Development Strategies Rooted in Menu Engineering?
- How Does Price Presentation Change What Guests Order?
- Which Layout and Copywriting Tricks Guide What Guests Choose?
- When Should You Simplify Your Menu Instead of Expanding It?
- How Do LTOs Help You Test New Menu Items Safely?
- How Do Trends and Dayparts Shape a Smarter Menu?
- What Sourcing and Portion Tactics Protect Your Margins?
- How Long Does a Menu Redesign Take and What Does It Cost?
- Which KPIs Tell You Whether a Menu Change Worked?
- What Do Real Menu Changes Actually Look Like in Practice?
- What Is the Step-by-Step Checklist for Launching a Menu Update?
- What Rules of Thumb Actually Hold Up Across Different Restaurants?
- How Can Wits' End Solutions Support Your Next Menu Update?
- Where Can You Learn More About Menu Development?
- Frequently Asked Questions
- Sources
What Are Examples of Menu Development Strategies Rooted in Menu Engineering?
Menu engineering sorts every dish into four categories based on two numbers: how often it sells and how much profit it generates per sale. Stars are high popularity, high margin. Plow horses sell well but earn thin margins. Puzzles are profitable but underordered. Dogs are low on both counts. This four-quadrant framework tells you exactly what to promote, reposition, or cut.
Here's a simplified matrix using generic entree labels, the kind you could build in a spreadsheet this afternoon:
To build your own version, follow this sequence:
- Export 90 days (or 12 weeks) of item-level sales from your POS.
- Pull current recipe costs for every active menu item, including plating garnish.
- Allocate a rough labor cost per dish if you want a fuller margin picture.
- Calculate contribution margin (menu price minus food cost) for each item.
- Calculate PMIX, the percentage each item represents of total category sales.
- Plot units sold against contribution margin to place each dish in its quadrant.
Pro Tip: Run this matrix by category, not across the whole menu. A $28 steak and a $9 appetizer live in different profit worlds, and mixing them into one chart hides real patterns.
Practical menu design guidance confirms this baseline period matters: 12 weeks of data smooths out seasonal noise and one-off promotions that would otherwise skew your read on an item's true performance. Wits' End Solutions builds this exact process into our menu engineering framework for clients starting from scratch.
How Does Price Presentation Change What Guests Order?
Removing the dollar sign from your menu prices increases average guest spend by about 8%, or roughly $5.55 per check in the Cornell study that first documented the effect. The mechanism is simple: currency symbols trigger what researchers call the "pain of paying," and stripping them out softens that friction just enough to change ordering behavior.
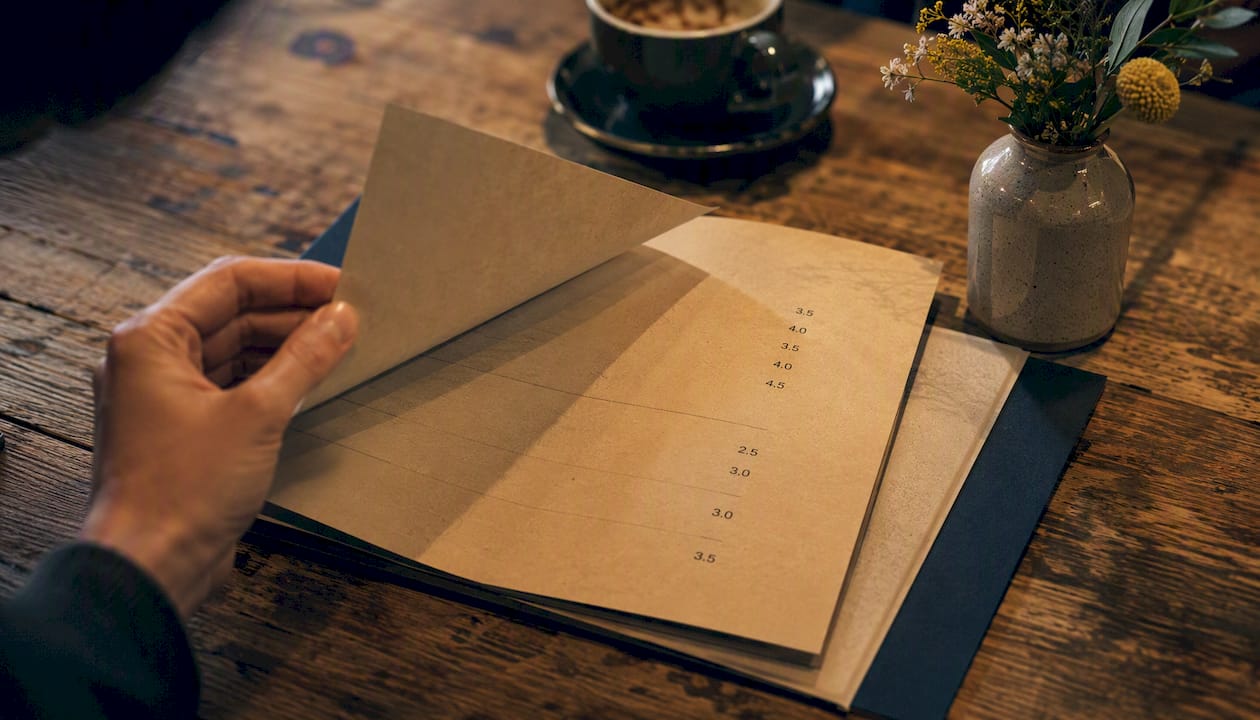
Charm pricing ($18.95 instead of $19.00) tends to work in casual and bistro settings where value perception drives the decision. Round-number pricing ($40 instead of $39.95) fits fine dining, where precision-cent pricing can actually undercut a premium feel. Neither is universally correct. The setting decides which one earns its keep.
If you want to test price presentation changes without guessing, run these one at a time:
- Remove the currency symbol entirely and track average order value for four weeks.
- Change decimal punctuation (18.95 versus 18,95 or 1895) and watch for any shift in order pace.
- Test round numbers against charm pricing on the same item across two comparable weeks.
- Move the price directly after the item name instead of right-aligned in a column, which discourages price-to-price comparison.
Measure impact through order share for the specific item, plus any delta in overall average order value. If you run a digital menu, track view-to-order ratio before and after each change; that number tells you whether guests are seeing the item and passing on it, or not seeing it at all.
Which Layout and Copywriting Tricks Guide What Guests Choose?
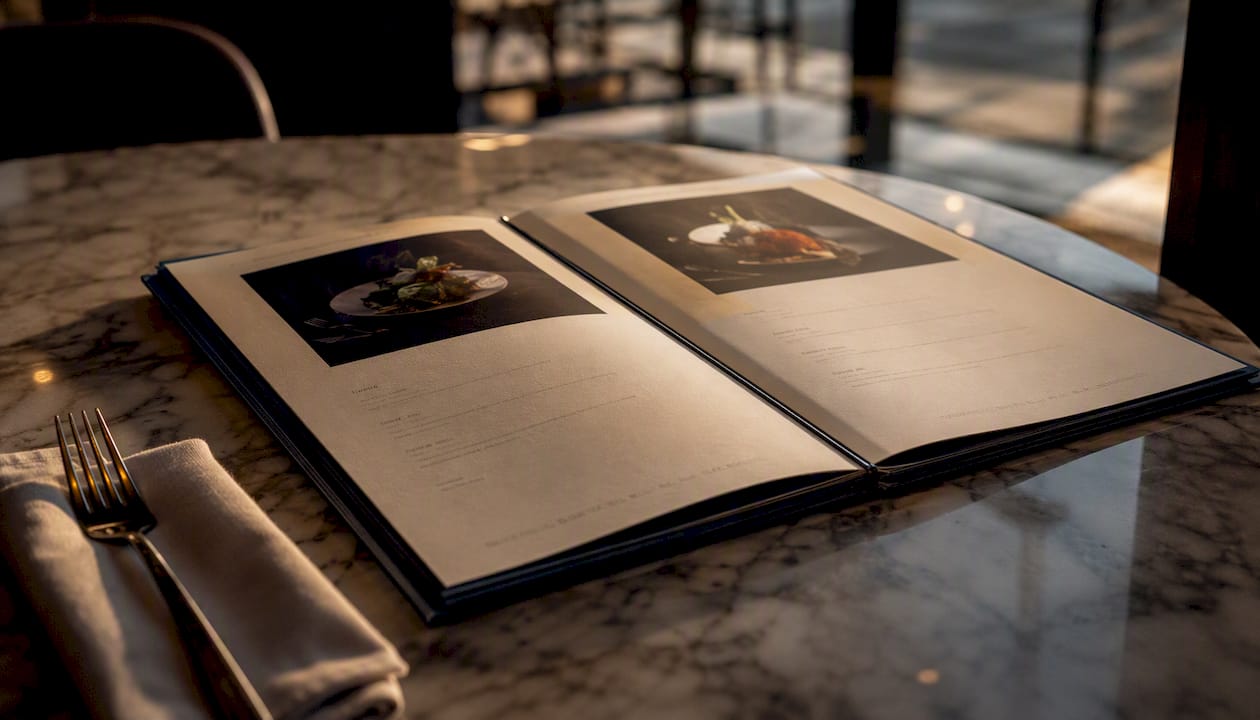
Placement and language move orders before a guest ever weighs price. Guests scan menus in a predictable pattern often called the golden triangle: middle, then top-right, then top-left. Put your Stars and Puzzles in that zone, and write descriptions that sell the experience, not just the ingredient list.
Compare these two versions of the same dish:
Before: "Chicken sandwich, lettuce, tomato, mayo, brioche bun."
After: "Buttermilk-brined chicken breast, hand-breaded and fried, stacked with pepper jack and smoked bacon on a toasted brioche bun."
Or take a simple side:
Before: "Mashed potatoes."
After: "Yukon gold mashed potatoes finished with roasted garlic and cracked black pepper."
Neither rewrite adds a single ingredient cost. Both add words a guest can taste before the plate arrives, a technique consistent with menu design best practices around evocative language.
Beyond copy, a few design levers do most of the heavy lifting:
- Place Stars and Puzzles in the golden triangle positions, never buried at the bottom of a long list.
- Use boxes or borders around one or two items per page maximum. Overuse flattens the effect.
- Reserve photos for true standouts. Photographed dishes see a 25 to 30% lift in orders on average, but that lift depends on scarcity.
- Skip leader lines (the dotted lines connecting item names to prices), which train the eye to hunt for the cheapest option.
Pro Tip: Limit photos to one or two per category and save badges like "Chef's Favorite" for items you genuinely want to push. A badge on every third item stops meaning anything.
When Should You Simplify Your Menu Instead of Expanding It?
Fewer, better items usually improve margins, kitchen execution, and guest satisfaction at the same time. A useful rule of thumb: target 5 to 7 items per category for a full-service concept. Beyond that, you're asking your line cooks to hold more prep in their heads and your guests to make a harder decision, and neither group benefits.
Run every item through a simple decision flow:
- Retain if it's a Star or a Puzzle with strong margin, even if popularity lags.
- Rework if it's a Puzzle with weak sales despite good margin. Try a new description, a photo, or a repositioning first.
- Prune if it's a Dog with low popularity and thin margin and no clear path to improvement.
Quick wins you can execute this week:
- Cut any item that's been a Dog for two consecutive quarters.
- Add a photo and a rewritten description to your top three Puzzles before cutting anything else.
- Simplify side dish options; three well-executed sides beat seven mediocre ones.
- Move seasonal items to a printed insert or digital rotation instead of permanent menu real estate, which keeps your core menu stable while still testing new ideas.
Digital menus make this easier since removing an item is a software update, not a reprint. Printed menus carry a real cost to change, which is exactly why a seasonal insert or clip-on card earns its place.
How Do LTOs Help You Test New Menu Items Safely?
Limited-time offers are the lowest-risk way to validate a recipe, a price point, and real guest demand before committing to a permanent menu change. Run them with a clear hypothesis and a short window, not as an open-ended experiment that quietly becomes permanent.
A test plan template that holds up across concepts:
- Hypothesis: State what you expect (e.g., "A plant-based burger will capture 8% of burger category sales").
- Control: Define what stays constant, usually your existing menu and pricing structure.
- Change: Specify the exact variable, whether that's a new dish, a new price, or a new description.
- Measurement period: Set a fixed window, typically two to four weeks.
- Sample size target: Decide how many units sold gives you a confident read, not just a handful of orders.
- Rollback criteria: Define in advance what performance triggers pulling the item.
Operational guardrails matter as much as the test design itself:
- Choose ingredients that cross over with existing prep to avoid new SKUs sitting in your walk-in.
- Train staff on the item and its story before day one, not on the fly.
- Cap back-of-house prep complexity; an LTO that slows your line during peak hours defeats its own purpose.
Watch view-to-order ratio for digital menus and PMIX share for physical ones. A strong hypothesis paired with weak PMIX tells you the idea was sound but the execution, price, or placement missed. Case-based tactics for converting underperformers into permanent Stars often start exactly here, with a repositioning or description test before any recipe change.
How Do Trends and Dayparts Shape a Smarter Menu?
Apply trends selectively, and prioritize the ones that share ingredients with dishes you already make. A trendy item that requires an entirely new supplier relationship and a dedicated prep station rarely earns its keep, no matter how well it photographs.
A few practical examples:
- Plant-based entree: Build it around a protein substitute that uses your existing sauce or marinade base, not a standalone recipe.
- Signature beverage: Create a house cocktail or mocktail using a syrup or infusion you can batch once and pour across three drinks.
- Snackable brunch item: Repurpose a dinner-service ingredient (braised short rib, roasted vegetables) into a smaller daytime portion.
Dayparting works the same logic in a different direction. Instead of running your full menu at 2:00 PM on a Tuesday, offer a condensed list during your slowest hours, or switch automatically between breakfast, lunch, and late-night menus if you're running a digital ordering platform. This keeps your kitchen focused and your ticket times fast when volume doesn't justify full complexity.
Trend adoption only works long-term when it fits your brand. A steakhouse chasing every viral drink trend confuses guests about what you actually do well. Choose trend items that extend your identity rather than dilute it, a point echoed in broader hospitality food trend coverage.
What Sourcing and Portion Tactics Protect Your Margins?
Margin protection starts before a dish ever hits the pass, at the sourcing and portioning stage. Yield testing, seasonal buying, and supplier negotiation for volume or consolidated deliveries all move your food cost percentage without touching a single menu price.
Building an accurate recipe cost card takes four steps:
- List every ingredient with its exact quantity per portion, down to the ounce or gram.
- Pull current invoice pricing, not the price you paid six months ago.
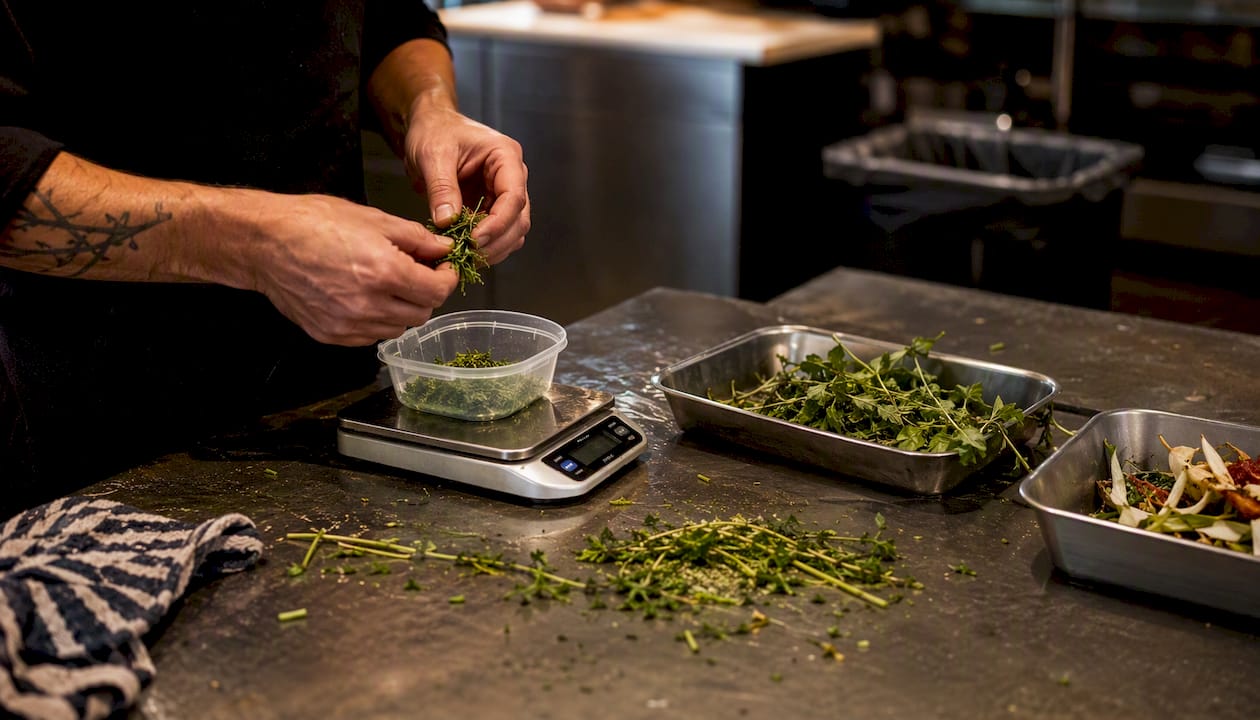
- Add a waste and yield factor. A whole chicken doesn't cost the same per usable pound as a boneless breast.
- Total the cost and divide by your menu price to get food cost percentage.
Cross-utilization example: a single roasted chicken can appear as an entree, shredded into a salad, and diced into a soup garnish. That's one purchase order, one prep process, and three menu placements, which simplifies inventory and reduces the odds of spoilage sitting in a walk-in.
A simplified cost card format you can adapt into your own spreadsheet:
Recipe costing needs to account for waste, supplier markups, and prep labor to reflect true cost, not just raw ingredient price. Skip labor and waste, and your "profitable" dish may actually be losing money once the line cook's time is factored in. Sourcing decisions also carry sustainability weight; operator guidance on sustainable sourcing increasingly ties cost control to reduced waste, which benefits both your margin and your footprint.
How Long Does a Menu Redesign Take and What Does It Cost?
A staged approach, audit first, then test, then roll out, can be completed in 6 to 12 weeks for most independent operators. Full brand-level redesigns with new photography, new print materials, and extensive recipe development take longer and cost considerably more.
A realistic 90-day program breaks down like this:
- Weeks 1 to 3: Data audit. Pull sales history, build your engineering matrix, identify Stars, Puzzles, plow horses, and Dogs.
- Weeks 4 to 7: Testing phase. Run LTOs, price presentation tests, and description rewrites on your Puzzle candidates.
- Weeks 8 to 10: Finalize changes based on test results. Update recipe cards, train staff, prep new print or digital assets.
- Weeks 11 to 12: Launch and monitor closely for the first two weeks post-rollout.
Budget across these categories, not exact dollar figures, since costs vary widely by market and scope:
- Menu design and printing
- Professional photography (short-run, focused on Stars only)
- Recipe testing and yield trials
- Staff training time
- POS system updates and modifier configuration
Pro Tip: If your budget is tight, invest in analytics support or a short-term consulting engagement before committing to a full visual redesign. Knowing which items actually deserve a photo shoot saves you from spending on dishes nobody orders anyway.
Which KPIs Tell You Whether a Menu Change Worked?
Measure mix and contribution per cover, not just total revenue. Total revenue can rise for reasons that have nothing to do with your menu changes (a slow month recovering, a local event, weather). Item-level metrics tell you what actually happened at the plate level.
| Metric | Definition | Frequency | Target/Example |
|---|---|---|---|
| Units sold per item | Raw count of orders per dish | Weekly | Track trend, not just totals |
| Contribution margin | Menu price minus food cost | Monthly | Prioritize items above category average |
| PMIX | Item's share of category sales | Weekly | Flag items under 5% share for review |
| Average order value | Total check divided by covers | Weekly | Target 5 to 10% lift post-change |
| Voids and comps | Returned or comped items | Daily | Investigate any item above baseline rate |
| Waste percentage | Unused inventory as share of purchases | Weekly | Watch for items driving excess spoilage |
Short-term signals show up fast. A view-to-order ratio shift on digital menus often appears within two weeks of a change. Margin shifts take longer to confirm, usually 4 to 12 weeks, since you need enough volume to trust the number.
Market-basket analysis, which studies which items get ordered together, reveals natural upsell pairings you might not expect. A burger and a specific side might co-occur far more than your intuition suggests, which tells you exactly where a combo or suggestive-sell prompt could work. A weekly 15-minute analytics habit is enough to catch these patterns before they become obvious in a quarterly review.
What Do Real Menu Changes Actually Look Like in Practice?
A few concrete examples worth copying directly:
- Convert a Puzzle into a Star with a photo and a rewritten description alone, no recipe change required.
- Use an anchor item (a deliberately high-priced dish) to reframe every other price on the page as reasonable by comparison.
- Bundle a $2 beverage add-on with your top-selling entree to lift average order value without discounting anything.
- Reposition your highest-margin appetizer into the golden triangle zone and track PMIX shift over four weeks.
Wits' End Solutions ran a mini engagement with a full-service concept struggling with a bloated 40-item menu and flat average order value. The approach followed the same sequence outlined throughout this article: pull 12 weeks of POS data, build category-level matrices, identify three Puzzles and four Dogs, then test description and photo changes on the Puzzles while cutting the Dogs entirely.
The menu went from 40 items to 27. Average order value rose within the first six weeks of testing, and food cost percentage improved as cross-utilized ingredients replaced several standalone Dog recipes. No prices were raised across the board. The lift came entirely from mix shift toward higher-margin items already on the menu.
The methodology behind that result was straightforward: a 90-day sales pull, category-segmented matrices, four weeks of description and photo testing on Puzzle candidates, and a weekly analytics check-in throughout.
Results like this depend heavily on customer fit and brand alignment. A tactic that works for a casual full-service concept may not translate directly to a quick-service or fine-dining operation, so treat every example here as a starting hypothesis to test in your own environment, not a guaranteed outcome.
What Is the Step-by-Step Checklist for Launching a Menu Update?
- Pull 12 weeks of POS data. (2 to 3 hours)
- Build your category-level engineering matrix. (1 to 2 days)
- Update recipe cost cards for every changed item. (2 to 3 days)
- Finalize new pricing and presentation format. (1 day)
- Write and proof new item descriptions. (1 to 2 days)
- Coordinate with marketing on any announcement or social content. (2 to 3 days, run in parallel)
- Update POS modifiers, buttons, and kitchen display tickets. (1 day)
- Train front-of-house and back-of-house staff on changes. (1 to 2 hours per shift)
- Print or publish updated menu across all guest touchpoints. (1 day)
- Monitor sales and voids closely for the first two weeks post-launch. (ongoing, 15 minutes daily)
On launch day, run these quick QA checks before the first table is sat: confirm pricing matches across print, digital, and POS; verify allergy flags transferred correctly to any new items; check that portion photos (if used for training) match actual plating; and test every new POS modifier button before service starts. Coordination across marketing, culinary, and service teams matters most in the week before launch. A menu change that surprises your servers on a Friday night creates confusion guests will notice.
What Rules of Thumb Actually Hold Up Across Different Restaurants?
The first thing we do on any menu engagement is pull the data before touching a single recipe or price. Every operator has a gut instinct about which dish is "the best one," and that instinct is wrong more often than owners expect once the actual PMIX numbers come in.
Three rules of thumb have held up across nearly every concept we've worked with. Review your matrix quarterly, since a monthly cadence generates noise and an annual one lets problems compound too long. Keep categories to 5 to 7 items, because that ceiling forces discipline on what actually deserves a spot on the menu. And build a weekly 15-minute habit of checking item-level sales, because small signals caught early are cheap to fix and expensive to ignore. None of these require new software or a full redesign. They require attention, applied consistently, to numbers most operators already have sitting in their POS system.
How Can Wits' End Solutions Support Your Next Menu Update?
Wits' End Solutions runs menu development the same way we approach every operational engagement: with the numbers first, and the creative second. If you've read this far, you already have the framework. What you may not have is the time to pull 12 weeks of data, build category matrices, and run four rounds of description testing while also running a restaurant.
Our engagements typically include:
- Menu engineering audits using your own POS data and recipe costs.
- Recipe costing and portion standardization to protect margin before a single price changes.
- LTO program design, including hypothesis, test window, and rollback criteria.
- Ongoing analytics subscriptions through our Ingest reporting platform so you keep the weekly cadence going after we leave.
- Brand-aligned menu and language development for concepts planning a fuller redesign.
Most engagements start with an audit, move into a testing phase, and end with a rollout plan your team can execute. If you'd rather have a partner build the matrix, run the tests, and hand you the results than build it yourself over the next quarter, reach out to Wits' End Solutions to scope a menu audit for your concept.
Where Can You Learn More About Menu Development?
- Menu Engineering: Your Way to Restaurant Profitability — a clear walkthrough of the four-quadrant framework paired with PMIX analysis.
- Restaurant Menu Design: What Sells — practical guidance on data pulls, category sizing, and layout priority.
- Beware Menus: Don't Use Dollar Signs — the original research behind currency symbol removal and guest spend.
- Menu Engineering 2026: Design a Menu That Sells More — covers digital analytics, photo lift data, and weekly testing habits.
- Menu Engineering for Stronger Profits — contribution margin math and choice architecture tactics like anchoring and decoys.
- What Is Menu Engineering? A Guide for Restaurants — a fuller primer if you want more background before building your own matrix.
Frequently Asked Questions
What are the most effective examples of menu development strategies for a small independent restaurant? Menu engineering, price presentation adjustments, and selective simplification deliver the fastest results with the lowest cost. All three use data you already have in your POS system.
How often should I update my menu? Review your engineering matrix quarterly at minimum. Full menu redesigns typically happen every 12 to 18 months, though seasonal inserts and LTOs can rotate far more often without touching the core menu.
Do I need special software for menu engineering? No. A spreadsheet and a POS export are enough to build a basic matrix. Digital analytics platforms speed up the process and enable weekly tracking, but they're not required to start.
How many items should be on my menu? Aim for 5 to 7 items per category for a full-service concept. Quick-service and specialized concepts may run leaner depending on kitchen capacity and guest expectations.
What's the fastest way to test a new menu item? Run a limited-time offer with a four-week window, a clear hypothesis, and defined rollback criteria before committing to a permanent menu placement.
Sources
- Beware menus: don't use dollar signs | Cornell Chronicle
- Menu Engineering: Your Way to Restaurant Profitability | NetSuite
- Restaurant menu design: what sells - Tableview
- Menu Engineering 2026: Design a Menu That Sells More | Intermenu