TL;DR:
- Menu engineering transforms menus into profit management tools by analyzing sales data and contribution margins. It classifies items into four categories—Stars, Plowhorses, Puzzles, and Dogs—to guide pricing and placement strategies for profit growth. Regular reviews and strategic design choices maximize a restaurant's financial performance and guest experience.
The menu engineering process is a structured method that uses sales data and contribution margin analysis to turn your menu into a financial tool that actively manages profitability. Developed by Kasavana and Smith, the framework transforms a menu from a simple list into a guest-perception and profit management system. Operators who implement it fully can see profit lifts of 12%–18% within 90 days. Industry standards call for a quarterly review cycle using 30–90 days of POS data, making this a repeatable discipline rather than a one-time project.
What is the menu engineering process and how does it work?
Menu engineering is the practice of classifying every item on your menu by two metrics: popularity and contribution margin. Popularity is measured as each item's share of total units sold, called its menu mix percentage. Contribution margin is the selling price minus the direct plate cost. Both figures come from your POS system and your recipe cost database.

Once you have those two numbers for every item, you calculate the average contribution margin and the average popularity across the full menu. Those averages become the axes of a 2x2 matrix. Every item lands in one of four quadrants.
| Quadrant | Popularity | Contribution Margin | Label |
|---|---|---|---|
| Stars | High | High | Protect and promote |
| Plowhorses | High | Low | Improve profitability |
| Puzzles | Low | High | Increase visibility |
| Dogs | Low | Low | Remove or overhaul |
The four labels come directly from the Kasavana and Smith framework. Stars are your best performers on both dimensions. Plowhorses sell well but leave less money on the table per cover. Puzzles are profitable per plate but guests rarely order them. Dogs drain margin and volume simultaneously.
Pro Tip: Most menus contain more Plowhorses than operators expect. A single Plowhorse that sells 200 covers a week and earns $2 less than average costs you $400 weekly in unrealized margin. That math makes cost control on Plowhorses one of the fastest wins available.
The matrix works for any restaurant with a few weeks of trading data, not just large chains. Menu engineering applies at every scale, from a 40-seat neighborhood bistro to a multi-outlet hotel food and beverage group.
How to execute the menu engineering process step by step
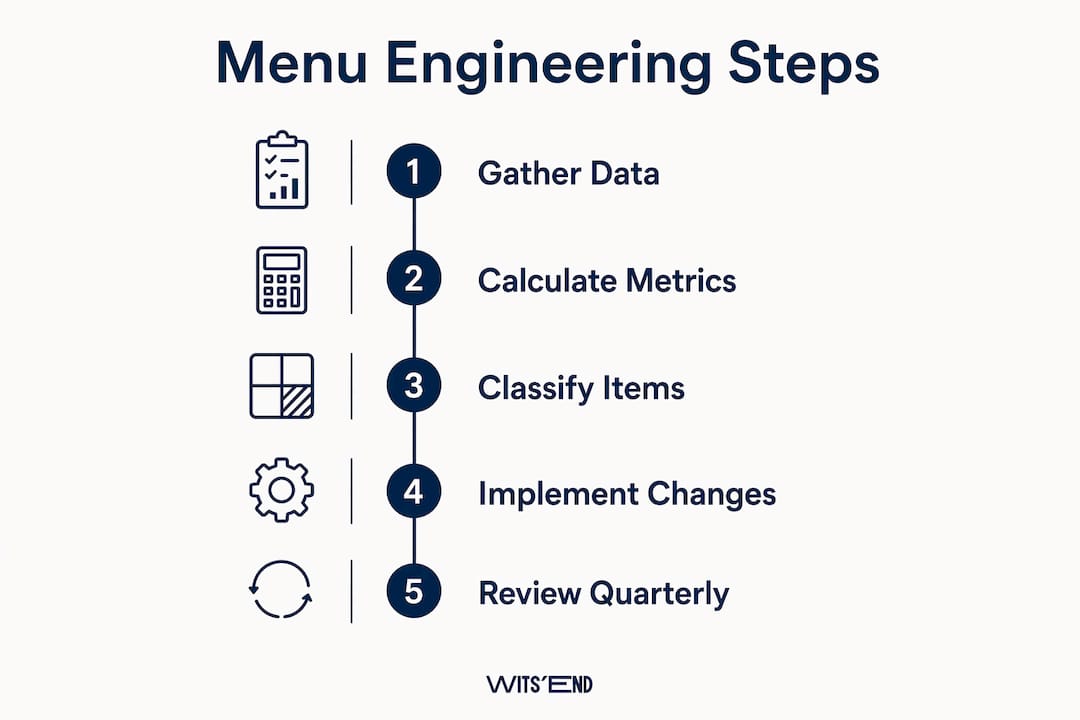
The practical execution follows five stages. Skipping any one of them produces unreliable matrix output.
-
Build your recipe cost database. List every ingredient in every dish with current purchase prices and yield percentages. This stage represents the majority of the total effort. Inaccurate recipe costing is the single largest barrier to reliable matrix output. Treat this database as a living document, not a one-time spreadsheet.
-
Export POS sales data. Pull 30–90 days of item-level data showing units sold and gross revenue per item. Shorter windows miss demand patterns. Longer windows dilute the effect of recent price or cost changes. Quarterly analysis with fresh data accounts for seasonal ingredient cost shifts.
-
Calculate contribution margins. For each item, subtract plate cost from selling price. Then find the average contribution margin across all items. Repeat the same average calculation for menu mix percentage.
-
Plot the matrix. Place each item on the 2x2 grid using its contribution margin and popularity relative to the averages. Items that sit exactly on an axis boundary deserve a judgment call based on trend direction.
-
Interpret and act. The matrix tells you where each item stands today. Your job is to decide what to do about it. Limit changes to 2–3 items per quadrant per quarter so you can measure the impact of each move before making the next one.
Pro Tip: Run your analysis in a spreadsheet that auto-calculates averages as you add items. A formula error in the average row will misclassify every item on the matrix. Audit the math before you plot anything.
The quarterly cycle is not arbitrary. Ingredient prices shift with seasons, and guest preferences drift. A dish that was a Star in the fall can slide toward Plowhorse territory in the spring if produce costs rise. Seasonal menu updates and regular re-plotting keep your strategy current.
What actions should you take for each menu quadrant?
The matrix is only useful if it drives decisions. Each quadrant calls for a different response.
Stars
- Feature them in prime menu real estate: top-right of a page, or first and last in a category list.
- Write compelling descriptions that reinforce perceived value.
- Do not discount Stars. Their margin and volume are already working for you.
- Protect their quality. A Star that slips in execution becomes a Plowhorse fast.
Plowhorses
- Audit the recipe for cost reduction without changing the guest experience. Portion calibration and supplier negotiation are the first levers.
- Test a modest price increase of $1–$2. High-volume items often absorb small increases without a drop in orders.
- If neither lever works, consider repositioning the item as a smaller format or a component of a higher-margin bundle.
Puzzles
- Move them to a more prominent position on the menu.
- Add a callout box or a server recommendation note to increase trial.
- Test a price reduction to see whether demand responds. A Puzzle that converts to a Star through a small price cut often nets more total margin than it did at the higher price.
Dogs
- Remove them unless they serve a specific operational or guest-retention purpose.
- If removal creates a gap in a category, replace with a new item designed from the start to hit Star or Puzzle territory.
- Do not let sentiment keep Dogs on the menu. Every cover a Dog occupies is a cover that could have gone to a higher-margin item.
Pacing changes to 2–3 per quadrant each quarter prevents kitchen disruption and gives you clean data on what each change actually did to sales and margin.
Pro Tip: Before removing a Dog, check whether it anchors a dietary category, like the only gluten-free entrée or the only vegan option. Removing it may cost you more in guest attrition than the margin drain is worth.
How does menu design reinforce your engineering decisions?
Menu design and financial analysis must work together. A visual playbook that does not promote your most profitable items will not maximize margins, regardless of how accurate your matrix is.
Several design principles directly support the engineering work:
- Visual hierarchy: Callout boxes, icons, and white space guide guest attention. Boxed items draw 2–3 times more attention than standard listings. Reserve callout boxes for Stars and high-priority Puzzles.
- Placement: High-margin items belong at the top-right of a two-page spread and at the start and end of each category. Guests read menus in a roughly Z-shaped pattern, and those positions capture the most attention.
- Price presentation: Removing currency symbols can increase average check size by 8% or more by reducing the psychological friction of seeing a dollar sign. Write "Grilled Salmon 34" instead of "Grilled Salmon $34.00."
- Price column alignment: Never stack prices in a right-aligned column. A vertical column of numbers trains guests to scan prices first and descriptions second. Embed prices at the end of the description text instead.
- Physical vs. digital menus: Physical menus set guest price expectations and perceived quality before a single item is read. A well-produced tactile menu signals premium positioning. Digital menus offer speed and flexibility for price updates. The best operators use both, with the physical menu carrying the brand weight and the digital version handling real-time changes.
Effective menu design reduces cognitive load on guests and guides them intuitively toward the items you want them to order. That is not manipulation. It is good hospitality.
Key takeaways
The menu engineering process delivers measurable profit improvement when operators combine accurate cost data, disciplined matrix analysis, and design decisions that promote high-margin items.
| Point | Details |
|---|---|
| Profit impact is real and fast | Operators typically see 12%–18% profit improvement within 90 days of full implementation. |
| Recipe costing is the foundation | An inaccurate cost database makes the entire matrix unreliable. Build it first and keep it current. |
| Quarterly cycles sustain results | Re-plot the matrix every quarter using fresh POS and ingredient cost data to stay ahead of seasonal shifts. |
| Pace your changes | Limit 2–3 changes per quadrant per quarter so you can measure each move's actual impact. |
| Design amplifies the analysis | Callout boxes, price presentation, and item placement turn engineering decisions into guest behavior. |
What I've learned from running this process in real restaurants
The operators who get the most from menu engineering are not the ones with the fanciest tools. They are the ones who treat recipe costing as an ongoing operational task, not a project they complete once and forget. I have seen beautifully constructed matrices built on cost data that was 18 months out of date. The quadrant placements looked authoritative. They were wrong.
The second pattern I see consistently is operators trying to change too much at once. They run the analysis, identify six Dogs, three Plowhorses that need repricing, and two Puzzles that need repositioning, and then attempt all of it in a single menu reprint. Six weeks later, sales have shifted in ways they cannot attribute to any specific change. The discipline of limiting yourself to 2–3 moves per cycle feels slow. It is actually faster, because you learn something useful from each change instead of creating noise you cannot interpret.
The physical menu question comes up in almost every engagement. Operators assume digital is always better because it is cheaper to update. That is true for price changes. It is not true for brand perception. A guest who picks up a well-designed, quality-printed menu has already formed a positive expectation before reading a single item. That expectation affects what they order and what they are willing to pay. Do not give that up for the convenience of a QR code.
The menu creation process and the engineering process are not separate disciplines. They feed each other. Build menus with engineering in mind from the start, and the quarterly analysis becomes far less painful.
— Chris
How Wits' End Solutions supports your menu profitability work
Wits' End Solutions works with restaurant operators and food and beverage groups across the United States on exactly this kind of work. Our deep analytics and advising service gives you the data infrastructure to run accurate, repeatable menu analysis without building it from scratch. We also bring brand design and development expertise to translate your engineering decisions into menus that actually influence guest behavior. For teams that need hands-on support embedding these practices into daily operations, our training programs give your managers the skills to sustain the process long after we step back.
FAQ
What is the menu engineering matrix?
The menu engineering matrix is a 2x2 grid that classifies menu items by popularity and contribution margin into four categories: Stars, Plowhorses, Puzzles, and Dogs. Each category calls for a different pricing or placement strategy.
How often should you run menu engineering analysis?
Industry standards recommend a quarterly review using 30–90 days of POS data. Quarterly cycles account for seasonal ingredient cost changes and shifting guest preferences.
What data do you need to start menu engineering?
You need item-level POS sales data showing units sold per item and a complete recipe cost database with current ingredient prices. Without accurate recipe costs, contribution margin calculations are unreliable.
Does removing currency symbols from menus actually increase sales?
Removing currency symbols can increase average check size by 8% or more by reducing the psychological discomfort guests associate with seeing a price. This is one of the most cost-effective menu design changes available.
Can small restaurants benefit from menu engineering?
Menu engineering applies to any restaurant with a few weeks of sales data. The Kasavana and Smith framework works at every scale, from independent operators to multi-unit groups.