
Toast POS reporting lives in Toast Web under the Reports menu, where the Weekly Overview opens by default. For a fast health check right now, pull these five reports in order: Sales Summary, Sales Breakdown, Product Mix (PMIX), Labor Summary (or Hourly Sales), and Cash Activity Audit. That sequence covers revenue, channel profitability, item performance, labor cost, and cash reconciliation in under ten minutes.
Here's how to get there immediately:
- Log in to Toast Web and click Reports in the left navigation.
- The Weekly Overview loads automatically. Scan net sales, labor %, and discounts.
- Use Quick Actions on the homepage to jump directly to Sales Summary or Labor Summary without navigating the full menu.
- From any dashboard tile, click through to the underlying report for line-level detail.
- Set a bookmark for Reports > Sales > Sales Summary so your opening manager can get there in two clicks.
Wits' End Solutions works with operators at this exact stage, helping teams configure reports, set permissions, and build the cadence that keeps data from sitting unread.
Key Takeaways
Consistent use of Toast's core reports, paired with a daily close routine and scheduled exports, gives operators the visibility to catch labor overruns, cash discrepancies, and underperforming menu items before they compound.
| Point | Details |
|---|---|
| Start with five core reports | Sales Summary, Sales Breakdown, PMIX, Labor Summary, and Cash Activity Audit cover daily operational health. |
| Dashboard refreshes hourly | Don't make staffing or comping decisions on mid-service dashboard numbers; drill to the underlying report for current data. |
| Custom Reports replace manual exports | One saved dashboard with metric highlights and a product-mix table eliminates most weekly CSV work. |
| Permissions gate visibility | Missing report categories almost always trace to a role permission or an inactive module like KDS or Toast Loyalty. |
| Wits' End Solutions | Provides custom dashboard setup, scheduled export configuration, and manager training to get reporting working from day one. |
Table of Contents
- Where Toast POS reporting actually lives in Toast Web
- The report categories and the ones that actually move the needle
- How to filter, build custom reports, and schedule exports
- Why some reports don't show up and how to fix it
- A reporting cadence that turns data into decisions.
- Useful Toast documentation to bookmark
- The gap between having reports and using them
- How Wits' End Solutions can set this up for you
- Sources
Where Toast POS reporting actually lives in Toast Web
The back-end, called Toast Web, is where all reporting happens. From the left navigation, click Reports and the Weekly Overview dashboard opens as the default landing page. It shows four key areas: sales, labor, guest counts, and top-selling items. You can compare the current week to the prior week, the same week last year, or two years prior.
The dashboard refreshes hourly, not in real time. That distinction matters during a busy Saturday lunch: the numbers you see at 12:15 PM reflect data captured at 12:00 PM. For intra-service reconciliation, drill through a dashboard tile to the underlying report, which pulls more current data, and plan to re-check after the next hourly cycle.
Quick Actions on the Toast Web homepage give you direct links to Sales Summary and Labor Summary without opening the full Reports menu. For opening and closing managers running a daily check, Quick Actions cut the navigation time significantly.
Pro Tip: During high-volume service, avoid making staffing or comping decisions based solely on the dashboard. Drill into the underlying report from the tile, then wait for the next hourly refresh to confirm the number before acting.
The report categories and the ones that actually move the needle
Toast's reporting suite organizes reports into eight primary categories: Sales, Labor, Menus, Payments, Cash and Loss Management, Accounts, Kitchen Operations, Marketing, and Other. Most operators only need to live in three or four of them day-to-day.
Sales category
- Sales Summary: Tiles called Sales Summary Cards cover revenue, cash, tips, voids, discounts, taxes, and dining option totals. You can reorder cards and click any tile to open its underlying detail report. Use it at daily close and for cash reconciliation.
- Sales Breakdown: Splits revenue by dining option (dine-in, takeout, online ordering, third-party delivery) and revenue center. The channel-level view is where you find out whether your delivery volume is actually profitable after fees.
- Product Mix (PMIX): Item-level sales counts, revenue, and modifiers. Run it weekly to identify what's selling, what's stagnant, and what's dragging down average check.
Labor category
- Labor Summary: Total labor cost and labor percentage against net sales. Check it daily alongside Sales Summary so you catch overtime before it compounds.
- Hourly Sales vs. Hourly Labor: Side-by-side view of sales volume and labor spend by hour. The most direct tool for scheduling decisions.
Payments / Cash and Loss Management
- Cash Activity Audit: Every cash transaction, drawer open, and payout in one view. Run it at every close to catch discrepancies before they become a pattern.
- Deposit Totals / Payout Overview: Monthly reconciliation against bank deposits.
Pro Tip: In Sales Breakdown, filter by dining option and revenue center together. Comparing your online ordering channel against dine-in on the same date range often reveals margin gaps that aggregate sales numbers hide.
Quick checks to run when something looks off: a spike in discounts points to a specific server, promo code, or modifier misconfiguration. A drop in digital sales warrants a check of your online ordering settings. Unexpected overtime shows up in Labor Summary before it hits payroll.
How to filter, build custom reports, and schedule exports
Toast's filter bar appears across most reports and lets you narrow by time frame, hours of day, employees, location, dining option, and revenue center. The Show/hide columns option lets you trim a report to only the metrics you need before exporting. Both features are available in the standard reporting interface without any add-ons.
Custom Reports builder lives at Reports > Custom Reports. You build a saved dashboard using table widgets, chart widgets, and metric highlight tiles, then drag and drop them into the layout you want. Filters apply at the dashboard level, and you can save and share the report without re-exporting every week. The builder limits concurrent filter types to three (for example, Day of Week, Revenue Center, and Employees), so plan your primary breakdowns before you build. Full setup instructions are in Toast's documentation.
One well-built custom dashboard with a product-mix table, a labor metric highlight, and a sales chart typically replaces most manual weekly Excel work. That's not a small gain for a manager who's been exporting three separate CSVs every Monday morning.
Export options by method:
| Method | Format | Best for |
|---|---|---|
| Download icon | CSV / XLS | Ad-hoc pulls, one-off analysis |
| Email Export | XLS / CSV link via email | Scheduled manager digests |
| Browser Print | Sharing with ownership or accountants |
Schedule a nightly or morning email export so your opening manager arrives with yesterday's numbers already in their inbox. If a specific report doesn't offer an email option, use browser print to PDF as the fallback.
For multi-location groups or operators who want to feed Toast data into external analytics tools, API-level access is available but generally requires a Restaurant Management Suite Pro subscription or higher. Worth knowing before you plan an integration project.
One known limitation: broad date-range comparisons in Sales Analytics can time out. If you're pulling a 90-day multi-location comparison, break it into monthly segments to avoid the timeout.
Why some reports don't show up and how to fix it
Missing reports almost always trace back to one of two causes: a role permission that wasn't enabled, or a module that isn't active on the account.
- Verify reporting permissions in Toast Web under Settings > Roles. Each role has granular reporting access toggles. If a manager can't see Labor reports, check whether the Labor reporting permission is enabled for their role.
- Report categories are gated by active modules. Kitchen Operations reports require KDS to be active. Marketing reports require Toast Loyalty. If a category is missing from the Reports menu entirely, the module likely isn't enabled on the account.
- Request an admin-level user to audit role permissions before assuming a report doesn't exist. Many operators discover reports they didn't know they had access to after a permissions review.
Beyond permissions, three data issues consistently skew report numbers:
- Unclosed shifts: An open shift from the night before inflates today's labor hours. Close all shifts before running Labor Summary.
- Missing time entries: Employees who clocked in manually or had a missed punch create gaps in Hourly Labor. Catch these in Time Entry Management before payroll runs.
- Unassigned sales categories or modifiers: Items without a category assignment don't appear correctly in PMIX or Sales Breakdown. Fix assignments in the menu configuration, then re-run the report for the affected period.
These aren't edge cases. They're the most common data quality problems we see when onboarding clients to Toast reporting, and they're all fixable within Toast Web without a support ticket.
A reporting cadence that turns data into decisions.
The goal of Toast POS analytics isn't more reports. It's fewer surprises. A consistent cadence, tied to specific action checks, is what separates operators who use reporting from operators who just have access to it.
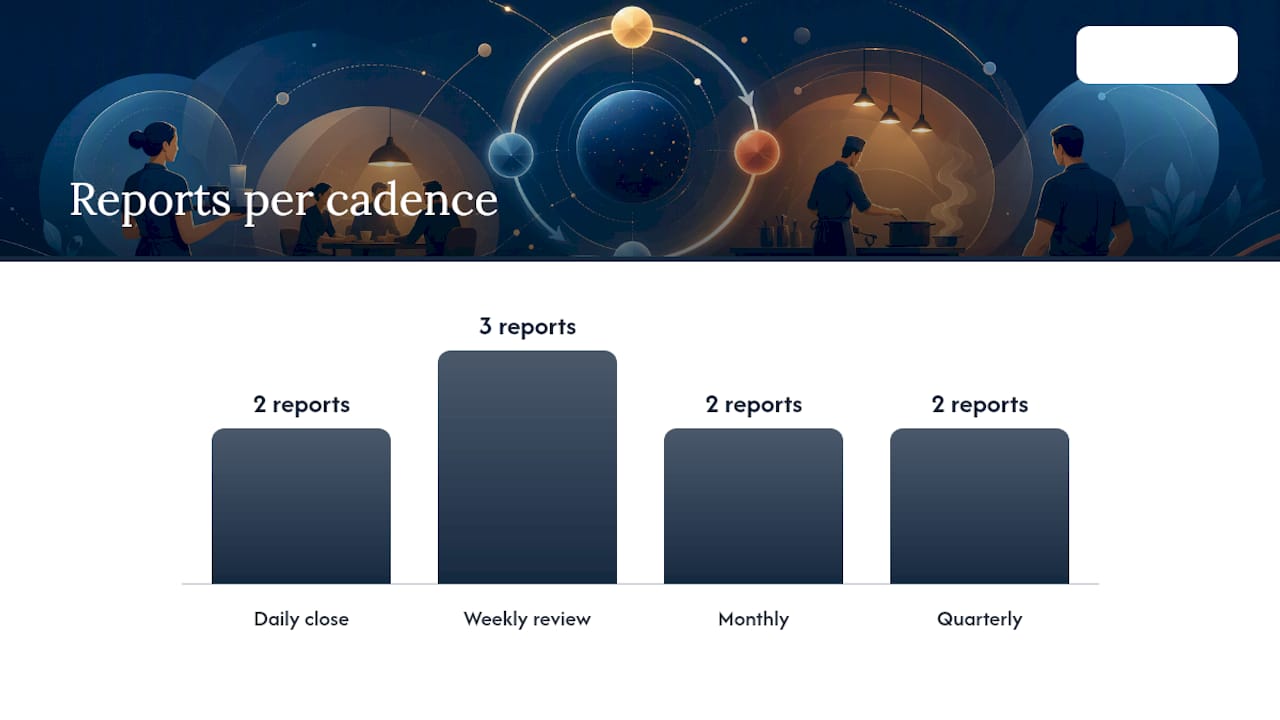
| Cadence | Reports to check | Key metrics | Action |
|---|---|---|---|
| Daily close | Sales Summary, Cash Activity Audit | Net sales, cash variance, voids, discounts | Reconcile cash drawer; flag unusual discounts for follow-up |
| Weekly review | Weekly Overview, Product Mix, Labor Summary | Labor %, top/bottom items, channel sales | Adjust next week's schedule; flag slow items for promotion or removal |
| Monthly | Deposit Totals, Accounting Overview | Bank deposit match, tax totals | Reconcile against bank statement; confirm tax liability |
| Quarterly | PMIX trend, Labor trend | Item mix shift, labor % trend | Menu engineering decisions; staffing model review |
Two scenarios that show how this works in practice:
Scenario 1: Discount spike. Sales Summary shows discounts up 18% week-over-week. Pull the Cash Activity Audit and filter by employee to identify which server applied the discounts. Cross-reference with the specific shift and check whether a promo code was misapplied or a modifier was incorrectly set to zero. Fix the modifier or revoke the promo access before the next service.
Scenario 2: Rising labor %. Labor Summary shows labor at 38% against a target of 30%. Open Hourly Sales vs. Hourly Labor and compare the 2 PM to 5 PM window. If labor spend is flat while sales drop sharply after 3 PM, you're overstaffed for the afternoon transition. Adjust the schedule to stagger cut times 45 minutes earlier. Pairing this with demand forecasting data makes the schedule adjustment more precise.

Toast's platform is designed to help operators shift from manual data entry to proactive management using automated nightly emails and dashboards that surface issues earlier. The cadence above is how you actually get there.
Useful Toast documentation to bookmark
These are the canonical Toast support pages for each reporting task. Save them directly; they include step-by-step navigation, known limitations, and export instructions.
- Get Started With Analytics and Reports — Overview of the full reporting suite, permission setup, and module dependencies. Start here if you're new to Toast reporting or troubleshooting access.
- Toast Reporting Dashboard: Weekly Overview — Covers the four dashboard areas, hourly refresh behavior, and comparison period options.
- Sales Reports Overview — Lists every report in the Sales category with descriptions and navigation paths.
- Sales Summary Report — Details on Sales Summary Cards, reordering, and drilling into underlying reports.
- Create Custom Reports for Toast POS — Step-by-step builder instructions, widget types, filter limits, and sharing options.
- Reporting Best Practices: Your First Day on Toast — Recommended reports for new operators, known limitations (timeout behavior, export gaps), and quick-action paths.
The gap between having reports and using them
Most operators I work with aren't missing data. They're missing a system for acting on it.
The pattern is consistent: a manager exports a CSV, opens it in Excel, spends 20 minutes formatting it, and then the insight gets buried in a folder. Meanwhile, the discount spike from Tuesday is still happening on Friday. Toast's reporting infrastructure is genuinely capable, but capability doesn't equal adoption. The teams that get the most out of it are the ones who've done three things: built one clean custom dashboard they open every morning, set up a scheduled email export so the numbers arrive without anyone having to pull them, and fixed their role permissions so every manager sees exactly what they need and nothing they don't.
The other mistake I see constantly is skipping the time entry audit before payroll. Labor Summary looks clean until you realize two employees have open shifts from the weekend. That's not a reporting problem; it's a process problem that reporting exposes, if you're looking.
How Wits' End Solutions can set this up for you
Getting Toast reporting configured correctly from the start saves operators hours every week. Wits' End Solutions builds custom dashboards, sets up scheduled email exports, audits role permissions, and trains managers on the daily and weekly cadence that keeps data working. For operators who want ongoing support, our deep analytics and advisory service includes monthly reporting reviews, menu engineering analysis, and labor trend tracking tied directly to your P&L targets.
The practical first step: a reporting audit that maps what you currently have access to, identifies permission gaps, and delivers one ready-to-use custom dashboard for your weekly manager meeting. No long-term commitment required to start. Reach out at Witsendsolutions to schedule a conversation.
Sources
- Reporting Best Practices: Your First Day on Toast
- Sales Reports Overview
- Get Started With Analytics and Reports
- Toast Reporting Dashboard: Weekly Overview
- Sales Summary Report Overview