
TL;DR:
- A restaurant P&L details all income and expenses over a period, revealing profit or loss.
- Operators should focus on prime cost and net profit percentages to assess financial health accurately.
A restaurant P&L, formally called an income statement or statement of operations, shows every dollar your restaurant earned and spent over a set period, and whether you ended with a profit or a loss. Open your most recent P&L right now and do two things: calculate prime cost (total food and beverage cost plus total labor) as a percentage of sales, then find net profit. Those two numbers tell you more about your restaurant's health than any other figures on the page.
Table of Contents
- What a restaurant profit and loss statement actually shows
- Line-by-line breakdown of a standard restaurant P&L
- Key metrics to calculate from your P&L
- How to read and interpret your restaurant P&L
- How often should you generate and review the P&L?
- Simple P&L template and a worked example
- How the P&L connects to your balance sheet and cash flow
- Operator tips from Wits' End: using the P&L to improve performance
- Key Takeaways
- The P&L is a conversation, not a verdict
- How Wits' End Solutions can help you get more from your P&L
- Useful sources and further reading
What a restaurant profit and loss statement actually shows
The P&L lists your sales, costs, and expenses during a defined period — a week, a month, a quarter — and produces a single bottom line: profit or loss. It goes by several names (income statement, statement of operations, P&L), but the function is identical regardless of what your accountant calls it.
Operators sometimes confuse the P&L with the other two core financial statements. Here is the practical difference:
- P&L (income statement): Shows performance over a period. Revenue minus costs equals net profit or loss. This is where you manage the business.
- Balance sheet: A snapshot at a single point in time showing what you own (assets) versus what you owe (liabilities). It does not tell you whether last month was profitable.
- Cash flow statement: Tracks actual cash moving in and out. A restaurant can show a profit on the P&L and still run out of cash, which is why using the P&L alone can mask liquidity issues.
The P&L's advantage is that it isolates operational performance and controllable costs — food, labor, and operating expenses — so you can see exactly where money is being made or lost.

Line-by-line breakdown of a standard restaurant P&L
Every restaurant P&L follows the same canonical order, from top-line revenue down to net profit. Understanding each line prevents the most common reporting errors.
| P&L Line Item | What to Include | Common Mistake |
|---|---|---|
| Revenue (Sales) | Dine-in, takeout, delivery, bar, catering, gift cards redeemed | Netting out comps/discounts before recording; record gross sales, then show discounts as a separate line |
| Cost of Goods Sold (COGS) | Food and beverage cost consumed (not purchased) | Using purchase invoices instead of physical inventory counts |
| Gross Profit | Revenue minus COGS | Skipping this subtotal and jumping straight to labor |
| Labor Costs | Wages, salaries, payroll taxes, benefits, workers' comp | Omitting owner salary or manager bonuses |
| Prime Cost | COGS + Labor (combined subtotal) | Not tracking this as a standalone metric |
| Operating Expenses | Marketing, supplies, credit-card fees, repairs, uniforms | Mixing capital expenditures (equipment purchases) with operating expenses |
| Occupancy Costs | Rent, property insurance, property taxes, CAM charges | Including depreciation here instead of below the EBITDA line |
| EBITDA | Earnings before interest, taxes, depreciation, and amortization | Treating EBITDA as the final profit figure |
| Depreciation / Interest / Taxes | Equipment depreciation, loan interest, income taxes | Omitting depreciation entirely on cash-basis books |
| Net Profit (Loss) | The true bottom line after all costs | Confusing net profit with cash in the bank |
A few line items need special handling:
- Discounts and comps: Record gross sales at full menu price, then show discounts as a separate deduction. This keeps your revenue data clean and lets you track comp costs independently.
- Credit-card fees: These belong in operating expenses, not as a revenue reduction. Netting them against sales distorts your gross margin.
- One-time adjustments: Equipment repairs, legal fees, or a one-time marketing spend should be flagged as non-recurring so they do not skew trend analysis.
- Delivery revenue: When analyzing third-party delivery, count only incremental costs — packaging, incremental labor — rather than re-allocating fixed costs like rent that you would pay regardless.
Prime cost is COGS plus total labor, expressed as a percentage of sales. It is the single most important operational control metric on the statement because it captures the two largest and most controllable cost categories together.
Pro Tip: Physical inventory counts are the only accurate way to calculate COGS. Relying on purchase invoices alone misses waste, theft, and spoilage, which means your food-cost percentage is almost certainly understated.
Key metrics to calculate from your P&L
The formulas below are the ones operators use every month. Run them on your own numbers as you read.
Core formulas:
- Food cost % = COGS ÷ Food & Beverage Sales × 100
- Labor % = Total Labor ÷ Total Sales × 100
- Prime cost % = (COGS + Labor) ÷ Total Sales × 100
- Gross margin % = Gross Profit ÷ Total Sales × 100
- Net profit % = Net Profit ÷ Total Sales × 100
Worked example (round numbers):
| Metric | Amount | % of Sales |
|---|---|---|
| Total Sales | $100,000 | 100% |
| COGS | — | 30% |
| Gross Profit | — | 70% |
| Labor | — | 35% |
| Prime Cost | — | 65% |
| Operating Expenses | — | around 15% |
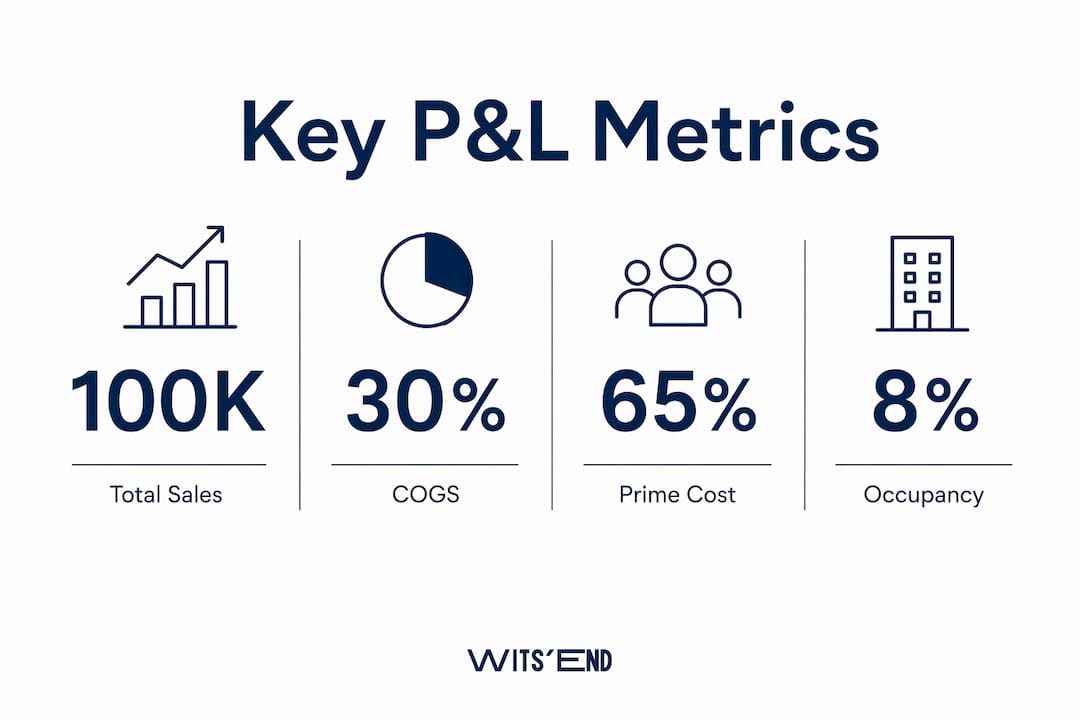
| Occupancy | — | around 8% |
| EBITDA | — | around 12% | | Net Profit | $7,000 | 7% |
U.S. benchmark ranges operators use as targets:
- Gross margin around 70% (implying food cost near 30% of sales)
- Labor costs generally average around a third of sales
- Prime cost ideally targets two-thirds of sales or less
- Net profit margins are generally expected to be positive and sufficient to sustain operations, varying by restaurant type
When your prime cost runs above 65%, the business is under pressure regardless of how strong sales look. A food cost at 34% with labor at 36% leaves only 30 cents of every sales dollar to cover rent, utilities, marketing, and profit — a margin that evaporates quickly. Tracking these percentages weekly, not just monthly, is what separates operators who catch problems early from those who discover them at month-end.
How to read and interpret your restaurant P&L
Reading a P&L is not about scanning for a single bad number. It is a diagnostic process that moves from the top of the statement down, comparing each line to a target and to prior periods.
Five things to inspect every month, in order:
- Sales variance: Compare this month's revenue to budget and to the same month last year. A 10% drop in dine-in sales with flat delivery revenue tells a different story than a 10% drop across all channels.
- Food cost variance vs. target: If food cost % moved more than one point from your target, find out why before closing the books. Common causes are a missed inventory count, a supplier price increase, or a high-waste week.
- Labor efficiency: Compare scheduled hours to actual hours worked, then check labor % against sales. A slow Tuesday that ran full staffing will show up here.
- Major one-offs: Identify any non-recurring expenses (equipment repair, a one-time legal fee) and note them separately so they do not distort trend lines.
- Credit-card fee changes: These creep up as delivery mix shifts. A 0.5% increase in blended card fees on $100,000 in monthly sales is $500 you may not have budgeted.
Variance analysis compares three columns: actual this period, budget this period, and actual prior period. A three-column P&L layout makes these comparisons faster and turns monthly management meetings into focused conversations rather than number hunts.
Pro Tip: Cross-check your POS sales totals against your P&L revenue line before finalizing the statement. Then validate COGS against your inventory system. Discrepancies between POS data and the P&L are almost always a sign of missing invoices, unrecorded waste, or a data-entry error.

How often should you generate and review the P&L?
The right cadence depends on what you are trying to control. Daily reviews catch labor and sales issues in real time. Weekly reviews catch cost drift before it compounds. Monthly reviews close the books and inform strategy.
Daily:
- Sales vs. daily forecast (pulled from your POS)
- Labor hours vs. schedule
- Major food item movement (proteins, high-cost specials)
Weekly:
- Running P&L snapshot with prime cost calculated to date
- Inventory spot-check on high-cost categories
- Gross margin trend vs. prior week
- Real-time prime cost tracking to adjust labor and ordering mid-month before losses accumulate
Monthly:
- Full P&L with all reconciliations and accrual adjustments
- Variance analysis (actual vs. budget vs. prior year)
- Payroll reconciliation and benefits accruals
- Review of occupancy and operating expense lines for any unexpected changes
Modern POS systems and inventory platforms can feed data directly into your reporting, reducing the manual work of building a weekly snapshot. A restaurant analytics dashboard that pulls from your POS and inventory system gives you a live view of prime cost without waiting for the accountant's monthly close. For a deeper look at how to structure your reporting cadence, restaurant analytics tips for operators covers the setup in practical terms.
Simple P&L template and a worked example
Use this template as your starting structure. Adapt the revenue rows to match your actual channels.
Blank P&L template (three-column format):
Worked example — step-by-step calculations:
| Line Item | Amount | % of Sales |
|---|---|---|
| Dine-In Sales | — | around 70% |
| Takeout / Delivery Sales | — | around 25% |
| Total Revenue | $100,000 | 100% |
| Food & Beverage COGS | — | 30% |
| Gross Profit | — | 70% |
| Hourly Labor | — | around 22% |
| Salaried / Management | — | around 8% |
| Payroll Taxes & Benefits | $5,000 | 5% | | Total Labor | — | 35% | | Prime Cost (COGS + Labor) | — | 65% | | Marketing | $2,000 | 2% | | Supplies | — | 3% | | Credit-Card Fees | — | — | | Utilities | — | 4% | | Repairs | — | 1.5% | | Total Operating Expenses | $13,000 | 13% | | Rent & Occupancy | — | around 8% |
| EBITDA | $14,000 | 14% | | Depreciation | — | 3% | | Interest | $2,000 | 2% | | Income Taxes | $2,000 | 2% | | Net Profit | $7,000 | 7% |
How to adapt this for multiple revenue streams:
- Add a separate revenue row for each channel (catering, private events, retail merchandise).
- Track COGS separately by channel if your POS supports it — bar COGS and food COGS behave differently and should not be blended without reason.
- For delivery, add an incremental cost row (packaging, third-party commissions) directly below delivery revenue so the channel's contribution margin is visible at a glance.
How the P&L connects to your balance sheet and cash flow
The three financial statements work together. Treating the P&L in isolation is one of the most common and costly mistakes operators make.
- P&L: Measures performance over a period. Net profit flows into retained earnings on the balance sheet.
- Balance sheet: Captures what the business owns and owes at a specific date. Inventory, equipment, accounts payable, and loans all live here.
- Cash flow statement: Tracks actual cash movement. A restaurant can show a net profit on an accrual-basis P&L while running out of cash — a scenario that catches operators off guard when they confuse accounting profit with available funds.
Common reconciliation items to check monthly:
- Depreciation: It appears as an expense on the P&L but involves no cash outflow. Add it back when reconciling to cash.
- Accounts payable timing: If you received $5,000 in produce invoices in March but paid them in April, the P&L shows the cost in March while cash does not leave until April.
- Inventory changes: A $2,000 increase in ending inventory reduces COGS on the P&L but does not reduce cash — you already spent that money when you bought the product.
- Prepaid expenses: Prepaid insurance or rent appears as an asset on the balance sheet and flows to the P&L as it is consumed.
Pro Tip: Once a month, compare your P&L net profit to the change in your bank balance. If profit is $7,000 but your bank balance only grew by $2,000, find the $5,000 gap. It is almost always sitting in accounts payable timing, a loan payment, or a capital purchase that did not run through the P&L.
Operator tips from Wits' End: using the P&L to improve performance
The P&L is a management tool. Operators who treat it as a monthly accounting obligation miss most of its value.
Weekly operator checklist:
- Pull a running prime cost calculation every Monday using the prior week's sales and COGS
- Verify inventory counts on your top five cost items (proteins, dairy, spirits) against POS usage
- Compare scheduled labor hours to actual hours for the prior week and flag variances above 5%
- Review any supplier invoices received against your contracted pricing
Margin improvement levers the P&L reveals:
- Percent-of-sales trend lines: A food cost that drifts from 30% to 32% over three months is a $2,000 monthly problem on $100,000 in sales. The P&L shows it; most operators only notice it when it hits 35%.
- High-margin item promotion: Use your P&L's gross margin data alongside your menu mix to identify which items contribute the most profit per cover. Menu engineering built on P&L data is more precise than intuition.
- Price testing before full changes: Run a limited price increase on two or three items for 30 days and measure the impact on food cost % and gross margin before rolling it out across the menu.
- Delivery economics: Calculate delivery's contribution margin separately. If third-party commissions push your effective food cost on delivery orders above 40%, the channel may be diluting overall margins even as it adds top-line revenue.
One-week action plan:
- Pull your last full monthly P&L and calculate prime cost % and net profit %.
- Compare food cost % to your target. If it is more than one point off, count your top five inventory items and reconcile against POS usage.
- Run a labor efficiency check: actual hours vs. scheduled hours for the past two weeks.
- Identify the three highest-margin items on your menu and confirm they are featured prominently.
- Set a recurring weekly calendar block to review a running P&L snapshot every Monday morning.
Pro Tip: Pair a simple P&L template with daily POS sales exports and a weekly inventory count. That combination gives you a light-touch control system that supports fast decisions without waiting for month-end close.
Key Takeaways
A restaurant P&L is only as useful as the cadence and discipline you bring to reading it — prime cost and net profit percentage are the two numbers that reveal whether your operation is fundamentally viable.
| Point | Details |
|---|---|
| Check prime cost first | Prime cost (COGS + labor) as a % of sales is the top operational control metric; target 65% or below. |
| Use percent-of-sales comparisons | Express every line item as a % of sales to catch cost drift before it erodes margins. |
| Match reporting cadence to decisions | Daily for labor and sales, weekly for prime cost and inventory, monthly for full reconciliation and strategy. |
| Reconcile P&L to cash flow monthly | A profitable P&L can coexist with a cash shortfall; check the gap between net profit and bank balance every month. |
| Wits' End Solutions | Provides P&L reviews, weekly reporting setup, and menu engineering tied directly to margin improvement for restaurant operators across the United States. |
The P&L is a conversation, not a verdict
Most operators open their P&L looking for a number to feel good or bad about. That framing misses the point entirely. The income statement is a record of decisions — every staffing call, every supplier negotiation, every menu price — and the most valuable thing it offers is the ability to see those decisions' consequences before they become permanent.
What I find operators underestimate is the power of the percentage column. The dollar figures shift with sales volume, which makes month-to-month comparisons noisy. But food cost at 31% versus 29% is a signal that holds regardless of whether you did $80,000 or $120,000 in sales that month. Operators who build the habit of reading percentages first, dollars second, stop being surprised at month-end. They start making corrections mid-month, when there is still time to matter.
The other thing worth saying plainly: a P&L that shows profit is not the same as a business that is financially healthy. Cash timing, deferred maintenance, and underfunded reserves can all hide behind a positive net profit line. The P&L is one lens. Used alongside the balance sheet and cash flow statement, it becomes a genuinely complete picture.
How Wits' End Solutions can help you get more from your P&L
If your P&L is producing numbers but not producing decisions, that is the gap Wits' End Solutions closes. We work with restaurant operators across the United States to set up weekly reporting systems, run prime cost recovery programs, and align menu engineering directly to margin targets — not just sales volume. Our deep analytics and reporting service gives operators a live view of their financials without waiting for month-end, and our task force engagements put senior operators on-site for turnarounds where the P&L has gone sideways and needs immediate correction. Whether you need a one-time P&L review or an ongoing analytics subscription, reach out to Wits' End Solutions to schedule a consultation.
Useful sources and further reading
- Restaurant P&L Statement — TableView: Covers the canonical P&L structure, prime cost definition, and the case for physical inventory counts over invoice-based COGS. Good starting reference for operators building their first statement.
- Restaurant Financial Statements 101 — NetSuite: Explains the relationship between the P&L, balance sheet, and cash flow statement, with clear guidance on why accrual-basis profit can mask cash shortfalls.
- Restaurant Financial Management Guide — NetSuite: Covers gross margin targets, labor benchmarks, and the financial management practices that separate sustainable operations from struggling ones.
- Restaurant Profit and Loss Statement Explained — WebstaurantStore: Practical walkthrough of P&L components with emphasis on using the statement as a forward-looking management tool for pricing and promotion decisions.
- Understanding Restaurant Financials — TouchBistro: Introduces the three-column P&L format (actual, budget, prior period) and explains how POS data feeds into financial reporting.
- Restaurant Financial Management — DoorDash for Merchants: Covers P&L basics from an operator's perspective, including how to handle delivery revenue and incremental cost analysis for third-party channels.
- Menu Engineering Process: A Profit-First Guide — Wits' End Solutions: Connects P&L margin data to menu design decisions, showing how to identify and promote high-contribution items.
- Restaurant Analytics Tips for Operators — Wits' End Solutions: Practical guidance on setting up reporting cadences and using analytics tools to automate the data that feeds your P&L.