
TL;DR:
- Guest satisfaction scores directly influence revenue, with higher scores leading to more repeat bookings and increased room rates. Tracking and improving these scores through operational changes can significantly enhance profitability and customer loyalty. Implementing continuous, embedded measurement and a structured feedback system drives lasting score improvements and revenue growth.
Guest satisfaction scores are a direct revenue signal. Hotels with higher scores see up to 35% higher repeat bookings, and a single point of reputation gain can lift room rates by about 11% while driving roughly 14% more direct bookings. That is not a marketing outcome. That is a P&L line. Treat your guest satisfaction score as a daily commercial input alongside occupancy and ADR, and you will find it predicts revenue shifts before they show up in your booking curve.
Table of Contents
- What are guest satisfaction scores and which metrics actually matter?
- How do guest satisfaction scores affect your revenue?
- How do you measure guest satisfaction and set realistic benchmarks?
- What drives guest satisfaction scores most?
- A prioritized playbook to raise your guest satisfaction scores
- How do you build a closed-loop feedback system that actually works?
- How do you calculate the ROI of improving guest satisfaction?
- The Wits' End Solutions five-domain framework for guest satisfaction
- Key Takeaways
- Why we build every engagement around guest scores
- How Wits' End Solutions helps you turn scores into revenue
- Useful sources and further reading
What are guest satisfaction scores and which metrics actually matter?
Guest satisfaction scores are quantified measures of how well a property's experience meets or exceeds guest expectations. The hospitality industry uses four primary metrics, and each answers a different business question.

| Survey Question | Scale | What It Measures | Best Use |
|---|---|---|---|
| "How satisfied were you with your stay?" | 1–5 stars or 1–10 | Post-stay snapshot of overall experience | Post-stay surveys, OTA benchmarking |
| "How likely are you to recommend us?" | 0–10 | Loyalty and word-of-mouth potential (NPS) | Quarterly loyalty tracking, brand health |
| "How much effort did it take to resolve your issue?" | 1–5 | Friction in service interactions (CES) | Front desk, housekeeping, F&B service |
| Composite weighted index | Normalized 0–100 | Cross-property executive tracking (GSI) | Multi-property groups, GM scorecards |
CSAT (Customer Satisfaction Score) is the workhorse metric. Calculate it as: (Satisfied responses ÷ Total responses) × 100. It gives you a fast post-stay read on specific touchpoints.
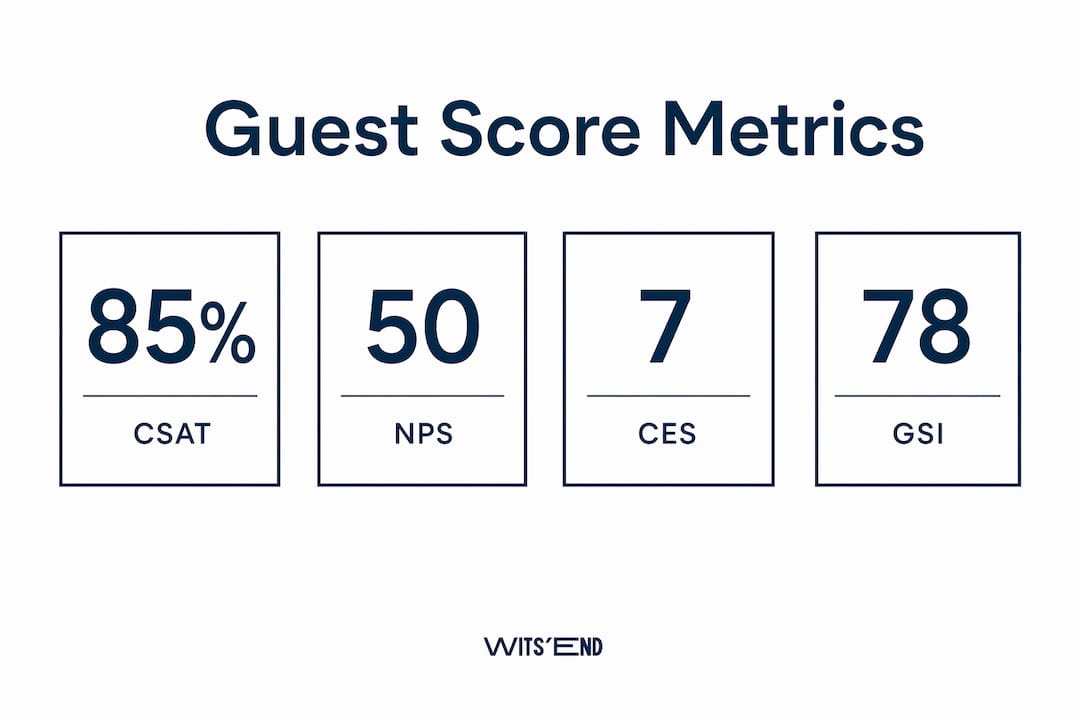
NPS (Net Promoter Score) separates your promoters (9–10) from detractors (0–6) and subtracts: % Promoters − % Detractors. Luxury properties with NPS above 50 show materially higher repeat-booking rates. NPS is your loyalty forecast, not your operational diagnostic.
CES (Customer Effort Score) identifies friction. A guest who had to call three times to get extra towels will score low on CES even if the room was spotless. Use it to find process failures before they become public reviews.
GSI (Guest Satisfaction Index) is a composite that groups typically weight as: 40% internal CSAT, 30% normalized Google score, 15% normalized OTA score, 10% TripAdvisor, and 5% operations KPIs. This weighting makes cross-property comparisons meaningful and gives your GM scorecard a single number to defend.
How do guest satisfaction scores affect your revenue?
The commercial case is well-documented. A meta-analysis of 535 correlations found strong positive associations between guest satisfaction and retention (r ≈ 0.60) and word-of-mouth (r ≈ 0.68), with smaller but consistent links to spending and price outcomes. Those are not soft metrics. Retention and word-of-mouth are the two levers that reduce customer acquisition cost and protect ADR simultaneously.

On OTAs, score is the tiebreaker. When two properties are priced within a few dollars of each other, the higher-rated listing converts more search traffic and can hold rate longer during soft demand periods. A property with a lower score has to discount more aggressively to fill rooms, which compresses RevPAR even when occupancy looks acceptable.
The repeat-booking dynamic compounds over time. Guests who had a five-star experience are 2.9x more likely to trust and 3.0x more likely to recommend compared to guests who had a one-to-two-star experience. For hotels, that trust translates directly into direct-channel bookings, which carry lower distribution costs and higher net ADR.
Consider a 120-room midscale property running at 72% occupancy with an ADR of $145. A one-point reputation gain that drives a 14% lift in direct bookings shifts roughly 12 room-nights per month from OTA to direct, saving $18–$22 per booking in commission. Cloudbeds research shows that properties with scores above 4.5 stars can achieve up to 35% higher repeat bookings and may realize up to a 20% premium on ADR. At scale, that is a material improvement in net revenue per available room without touching rate strategy.
How do you measure guest satisfaction and set realistic benchmarks?
Measurement works only when it is embedded in operations, not bolted on as a quarterly survey blast. The practical cadence has three stages.
Pre-arrival: A short confirmation message that sets expectations and captures any special requests. This is not a survey; it is a data-collection touchpoint that reduces friction on arrival.
Mid-stay: A brief check-in message at the 24-hour mark for stays of two nights or more. Catching issues mid-stay prevents them from becoming public reviews. Properties that run mid-stay checks consistently report better review velocity and higher post-stay scores.
Post-stay: A survey sent within two hours of checkout captures the freshest recall. Response rates drop sharply after 24 hours.
For ongoing monitoring, track review velocity (new reviews per week), average score by platform, and sentiment by category (cleanliness, service, value, location). Platforms like Amadeus integrate reputation data into PMS workflows so your revenue team sees score movement alongside booking pace.
What does "good" look like for U.S. hotels?
| Metric | Economy/Budget | Midscale | Upscale | Luxury |
|---|---|---|---|---|
| CSAT (1–5 scale) | — | 4.2 | 4.5 | — |
| NPS | 35 | 35–50 | 50 | — |
| Google Rating | — | 4.2 | 4.5 | — |
| OTA Score (10-pt) | — | 8.2 | 8.7 | 9.2 |
Set your internal targets 0.2–0.3 points above your current score, not at the segment ceiling. Chasing a luxury benchmark from a midscale baseline creates operational pressure without a clear path. Move incrementally and tie each target to a specific operational intervention.
Pro Tip: Plot your property and your top three competitors on a two-axis grid of price vs. guest score. Your quadrant position tells you whether to raise rate, defend price, or fix operations before any pricing move. This is the most underused tool in hotel revenue management.
What drives guest satisfaction scores most?
Value for money and service quality are the primary drivers of guest satisfaction in the hotel industry, with cleanliness, staff behavior, and F&B quality as close seconds. Understanding which driver is pulling your score down is the diagnostic step most operators skip.
- Cleanliness and housekeeping consistency: The single most cited complaint category in negative reviews. Inconsistency, not baseline quality, is usually the problem. One missed room in ten creates a disproportionate review impact.
- Front desk and service recovery: Speed and empathy at the front desk set the emotional tone for the entire stay. A well-handled complaint can produce loyalty stronger than an issue-free stay, which means your recovery process is a competitive asset.
- Value perception: Guests do not compare your property to its cost in isolation. They compare it to what they expected for that cost. Misaligned expectations, often driven by listing photos or description gaps, are a value-perception problem, not a product problem. Strong listing photography that accurately represents the property reduces expectation gaps before arrival.
- F&B quality and availability: On-site dining and beverage experience directly affects overall satisfaction scores, particularly for guests who do not leave the property. F&B optimization that improves both quality and speed of service shows up in overall CSAT within one to two months.
- Communication and timeliness: Guests who receive proactive updates (room-ready notifications, local recommendations, check-out reminders) consistently rate their stays higher than guests who had to ask for the same information.
- Personalization: Recognizing returning guests, honoring preferences from prior stays, and using pre-arrival data to anticipate needs are the highest-leverage personalization moves for most properties. Technology enables this, but the front desk executes it.
Pro Tip: Tag your text feedback by category (check-in, cleanliness, Wi-Fi, staff, F&B) and run a monthly frequency count. The categories with the most mentions are your highest-priority operational fixes, regardless of what your numeric scores say.
A prioritized playbook to raise your guest satisfaction scores
Improvement follows a sequence. Quick wins build momentum and buy credibility with ownership; medium-term investments build the systems that hold gains; long-term work compounds the advantage.
Quick wins (0–30 days)
- Launch mid-stay outreach. Send a brief message at the 24-hour mark for all multi-night stays. Assign the front office manager as owner. Track the number of issues caught and resolved before checkout.
- Tighten housekeeping inspection SOPs. Add a supervisor sign-off checklist for every room before it is released. Focus on the top five complaint items from your last 90 days of reviews.
- Send a post-stay survey within two hours of checkout. Use your PMS to automate the trigger. Even a three-question survey generates enough data to identify patterns within 30 days.
- Respond to every unaddressed review from the past 60 days. Responses signal to future guests that management is engaged. Response rate is a visible trust signal on every OTA listing.
Medium-term investments (30–90 days)
- Service recovery training: Give frontline staff a clear decision framework for resolving complaints on the spot, including pre-approved compensation options (room upgrade, F&B credit, late checkout). Wits' End Solutions' staff training programs are built around exactly this kind of frontline empowerment.
- Department-level CSAT targets: Break your overall score into housekeeping, front desk, and F&B sub-scores. Assign each department head a target and review it weekly.
- Pre-arrival communication sequence: Build a two-touch sequence: a confirmation with local tips sent 72 hours before arrival, and a room-ready notification on check-in day.
Long-term investments (90–365 days)
- PMS and CRM integration to capture guest preferences and automate personalization at scale.
- Targeted property improvements guided by your top complaint categories. Prioritize the items that appear in more than 15% of negative reviews.
- Precision hospitality practices that use data to anticipate needs rather than react to complaints.
How do you build a closed-loop feedback system that actually works?
Collecting feedback without a governance structure is worse than not collecting it. The data sits in a dashboard, no one acts on it, and scores drift. The closed-loop model has four stages.
1. Collect at every touchpoint (pre-arrival, mid-stay, post-stay, review platforms). Assign a single owner for each channel.
2. Analyze daily. A morning dashboard review by the GM or ops lead should flag any score below threshold, any new negative review, and any mid-stay complaint that was not resolved. Keep this to 10 minutes.
3. Act within defined SLAs. A negative review on a major platform should receive a management response within 24 hours. A mid-stay complaint should be resolved within two hours. A post-stay complaint that identifies a systemic issue should trigger a department-level review within 48 hours.
4. Measure the impact. Track whether resolved complaints result in updated reviews. Track whether departments that received targeted coaching show score improvement within 60 days.
Pro Tip: Build a weekly ops huddle agenda item specifically for guest feedback. Spend 10 minutes reviewing the week's lowest-scoring stays, identify the common thread, and assign one corrective action. This single habit, done consistently, compounds into measurable score improvement over a quarter.
Governance roles matter. The GM owns the overall score and the weekly review. The front office manager owns mid-stay resolution SLAs and review response. Department heads own their sub-scores and corrective action plans. Without named owners, accountability diffuses and scores stagnate.
Consistent service standards are the operational foundation that makes this governance model work. SOPs without accountability loops produce inconsistent results; accountability without SOPs produces inconsistent execution. You need both.
How do you calculate the ROI of improving guest satisfaction?
The calculation does not require a complex model. Start with three inputs: your current occupancy rate, your ADR, and your direct-booking percentage. Then apply the benchmark relationships from the research.
A worked example
A 100-room upscale property with 75% occupancy, $200 ADR, and 30% direct bookings generates annual room revenue.
- Score improvement target: Move from 4.3 to 4.5 on your primary OTA (a 0.2-point gain).
- Expected repeat-booking lift: Properties with higher scores see significantly higher repeat bookings, which can add a measurable occupancy increase.
- ADR premium: A one-point reputation gain correlates with a rate lift. A 0.2-point gain, applied conservatively, suggests a modest ADR improvement.
- Direct-booking shift: A lift in direct bookings shifts revenue from OTA to direct, saving distribution costs.
| Lever | Conservative Estimate | Annual Impact (100 rooms) |
|---|---|---|
| Occupancy lift (2 pts) | +730 room nights at $200 | — |
| ADR improvement (2%) | +$4/night on 27,375 nights | — |
Timeline to impact
- 30 days: Mid-stay outreach and housekeeping SOPs reduce complaint volume. Review response rate improves. No score movement yet, but the operational inputs are in place.
- 90 days: Post-stay survey data accumulates. First score improvements appear on internal CSAT. OTA scores begin to reflect the change as new reviews replace older ones.
- 365 days: Full impact on repeat-booking rate, ADR, and direct-booking mix. The revenue lift in the example above is a 12-month outcome, not a 90-day one.
The cost side is modest for the quick-win interventions. Mid-stay outreach costs almost nothing if your PMS supports automated messaging. Housekeeping SOP tightening is a training investment, not a capital one. The medium-term investments (staff training, CRM integration) typically run $15,000–$40,000 for a single property, against a potential revenue lift that is an order of magnitude larger.
The Wits' End Solutions five-domain framework for guest satisfaction
Most operators manage guest scores reactively. A score drops, they respond to reviews, they remind staff to smile. That approach produces temporary improvement and no structural change. The framework we use at Wits' End Solutions treats satisfaction as the output of five integrated operational domains, drawn from systematic hospitality research.
- Service quality: Consistent execution of SOPs across every touchpoint. The diagnostic signal is variance, not average. A property with a 4.3 average but a wide score distribution has a consistency problem, not a quality problem.
- Employee engagement: Frontline staff who feel supported and empowered deliver better service. Department-level CSAT targets tied to recognition programs are the most direct lever here.
- Technology-enabled personalization: Using PMS and CRM data to recognize returning guests, honor preferences, and anticipate needs. This does not require a luxury-level tech stack. It requires discipline in data capture and a front desk team trained to use it.
- Service recovery: The fastest path to a promoter is a well-handled failure. Transparency, empathy, and speed convert detractors. Properties that give frontline staff clear recovery authority (upgrade, credit, apology) resolve complaints faster and generate better post-recovery reviews.
- Emotional value co-creation: Moments that exceed functional expectations, a handwritten note, a local recommendation that lands perfectly, a room detail that reflects a guest's stated preference. These are the moments guests describe in five-star reviews and the ones that drive word-of-mouth.
The guest experience framework that underpins this approach recognizes that no single domain drives scores in isolation. Our work with U.S. hotel and restaurant clients spans all five domains, from training and SOPs to analytics and brand development, because that is the only way to produce score improvement that holds.
Key Takeaways
Guest satisfaction scores are a measurable revenue lever: a one-point reputation gain correlates with an 11% ADR lift, 14% more direct bookings, and up to 35% higher repeat-booking rates.
| Point | Details |
|---|---|
| Score is a revenue input | Track CSAT, NPS, and GSI daily alongside occupancy and ADR, not as a quarterly marketing task. |
| Mid-stay checks prevent public damage | A 24-hour check-in message on multi-night stays catches issues before they become negative reviews. |
| Service recovery builds loyalty | A well-handled complaint can produce stronger loyalty than an issue-free stay; give frontline staff recovery authority. |
| Wits' End Solutions | Wits' End Solutions applies a five-domain operational framework across U.S. hotel and restaurant clients to produce score improvement that holds. |
Why we build every engagement around guest scores
Guest satisfaction scores are the clearest signal we have that a property is operating the way it should. When we step into a hotel or restaurant, the first thing we pull is the score trend over the prior 12 months, broken down by category. That data tells us more about operational health than any P&L review in the first 30 minutes.
The properties that struggle with scores are almost never struggling because of product quality. They are struggling because of inconsistency, broken recovery loops, or a front desk team that has never been given a clear framework for handling a complaint. Those are fixable problems. The revenue upside from fixing them is real and measurable, and it compounds over time in ways that a single marketing campaign never will.
Our work with U.S. hotel and restaurant operators consistently shows that properties willing to treat their guest score as a commercial KPI, and build the governance to manage it that way, outperform their compset on both ADR and repeat-booking rate within 12 months. That is the outcome we build toward with every client.
How Wits' End Solutions helps you turn scores into revenue
Wits' End Solutions works with U.S. hotel and restaurant operators who want to close the gap between their current guest scores and what those scores should be producing in revenue. Our deep analytics and reporting practice links your satisfaction data directly to occupancy, ADR, and direct-booking trends so you can see the revenue impact of every score movement. Our training programs build the frontline service recovery and communication skills that drive score improvement at the department level. For properties in transition or turnaround, our task force engagements put senior operators on property to diagnose and fix the operational issues pulling scores down. If you want to understand exactly where your scores are leaving revenue on the table, schedule a consultation with our team and we will show you what the numbers say.
Useful sources and further reading
The evidence and benchmarks in this article draw from the following sources. Use them for deeper methodology, benchmarking context, and academic grounding.
- Cloudbeds: What Is Guest Satisfaction and How Is It Measured? — Industry benchmarks on repeat-booking lift, ADR premium, and direct-booking impact. Practical guidance on multi-touchpoint feedback collection. Best for: operational benchmarks and survey cadence.
- Springer Meta-Analysis: Customer Satisfaction and Firm Outcomes (Mittal et al.) — 535-correlation meta-analysis linking satisfaction to retention, word-of-mouth, spending, and firm-level financial outcomes. Best for: building the financial case with ownership or investors.
- RSI International: Enhancing Customer Satisfaction in Hospitality Operations — Systematic review proposing the five-domain Customer Satisfaction Enhancement Framework. Best for: academic grounding of the operational framework.
- Peaqplus: Hotel Reputation Management — Practitioner guide on using guest score as a revenue-management input, including the price-vs.-score competitor mapping method. Best for: revenue teams integrating reputation into pricing strategy.
- Hotel Performance: Guest Satisfaction Metrics That Predict Repeat Bookings — Analysis of NPS, CSAT, and GSI as the core predictive metrics for repeat bookings. Best for: KPI selection and composite index construction.
- Qualtrics XM Institute: ROI of Customer Experience, 2024 — Global consumer study (28,400 respondents) quantifying the loyalty impact of satisfaction across industries, including hotels. Best for: cross-industry benchmarking and executive presentations.
- OCEM Journal: Factors Influencing Customer Satisfaction in the Hotel Industry — Academic study identifying value for money and service quality as the primary satisfaction drivers. Best for: prioritizing operational investments.
- Wits' End Solutions: Deep Analytics and Reporting — Analytics and reporting services that link satisfaction metrics to revenue outcomes for U.S. hotel and restaurant operators.
- Wits' End Solutions: Training Programs — Frontline and manager training programs focused on service standards, recovery, and guest communication.