
Prime cost is the cost of goods sold (food and beverage) plus total fully burdened labor, and it is the single number that tells you whether your restaurant makes money. Most operators should target a prime cost of 55% to 65% of sales, depending on concept, and the immediate move is to calculate this week's number and review it promptly with your GM and chef.
TL;DR:
- Tracking inventory accurately and including all labor burdens are essential to calculating real food and labor costs, preventing underestimation.
- Prime cost targets vary by restaurant type, with fast casual aiming for 55-60%, full-service around 60-65%, and fine dining potentially up to 68%.
- Weekly prime cost review using sales, purchase invoices, and payroll data helps identify drift early and prevents larger issues from developing.
- Small, consistent adjustments in food portioning, vendor negotiations, and scheduling can compound into significant profit improvements over time.
- Focusing on the weekly cadence rather than a monthly review ensures operators catch and fix issues before they impact overall profitability.
Table of Contents
- What Counts Toward Restaurant Prime Cost?
- How Do You Calculate Prime Cost?
- What's a Healthy Prime Cost Benchmark for Your Format?
- Why Prime Cost Drives Your Profit More Than Any Other Number
- How Do You Actually Lower Prime Cost?
- What Should You Track Weekly, and When Do You Escalate?
- What Does a Practitioner's Prime Cost Checklist Look Like?
- What Should You Do This Week?
- The Real Problem Isn't the Math
- Sources
What Counts Toward Restaurant Prime Cost?
Prime cost only works as a management tool when both halves of the equation are complete. Leave out a payroll tax line or forget to adjust for ending inventory, and the number you're staring at is fiction dressed up as data.
Cost of goods sold covers everything that goes into producing what you sell:
- Food purchases across every category, from proteins to produce
- Beverage costs, alcoholic and non-alcoholic
- Packaging and disposables for to-go and delivery orders
- The inventory math itself: beginning inventory plus purchases, minus ending inventory, equals your true cost of goods sold for the period
That inventory calculation trips up more operators than anything else in this section. If you only track purchases and skip the physical count, you're measuring cash outflow, not actual usage. A walk-in that's quietly overstocked or a bar that's bleeding pours nightly will hide inside a purchases-only number.
Labor is where most restaurants underreport, sometimes by a wide margin. A complete labor figure includes hourly wages, salaried management compensation, employer-side payroll taxes, benefits, workers' compensation premiums, overtime, bonuses, and any paid tips processed through payroll. Skip the burden ratios (payroll taxes, workers' comp, benefits) and you can understate true labor cost by several percentage points, which makes your prime cost look healthier than it is right up until the P&L proves otherwise.
The two most common errors: pulling a payroll number straight from the bank statement instead of the fully burdened figure, and calculating COGS off purchase invoices without a period-end count. Both mistakes push your reported prime cost below reality, and both eventually get discovered the hard way.
How Do You Calculate Prime Cost?
The formula itself is straightforward. The discipline is in doing it the same way every week.
- Calculate your cost of goods sold. Take beginning inventory, add purchases for the period, subtract ending inventory. That's your real COGS, food and beverage combined.
- Calculate fully burdened labor. Pull your payroll export for the same period and add employer payroll taxes, benefits, workers' comp, and any processed tips or bonuses on top of gross wages.
- Add the two together. Prime cost equals COGS plus total labor, full stop.
- Divide by net sales and multiply by 100. That gives you your prime cost percentage: Prime % = Prime cost ÷ Net sales × 100.
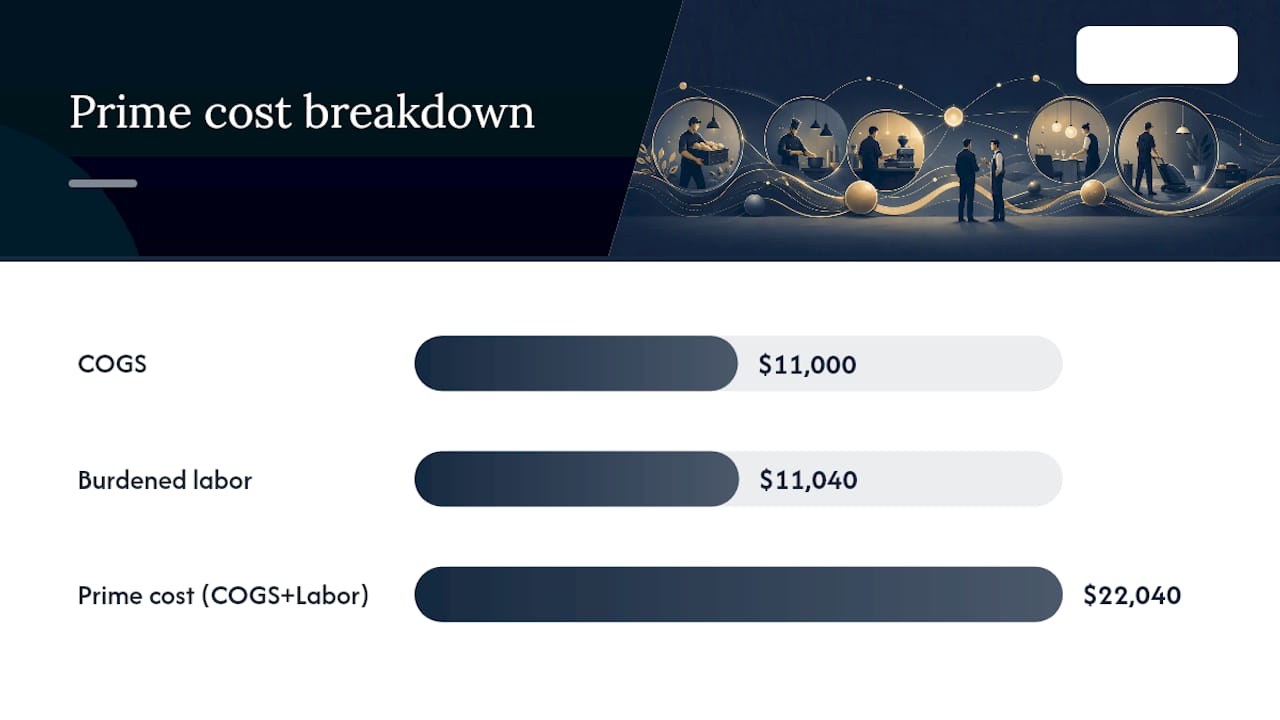
Here's a worked example using round numbers. Say your restaurant does $40,000 in net sales for the week. Beginning inventory was $12,000, you purchased $9,500 in food and beverage, and ending inventory came in at $10,500. That's $12,000 + $9,500 − $10,500 = $11,000 in COGS.
Your payroll export shows $9,200 in gross wages. Add appropriate burden percentages for payroll taxes, workers' comp, and benefits to gross wages to estimate total labor cost.
Add COGS and labor: $11,000 + $11,040 = $22,040 in prime cost. Divide by $40,000 in sales and multiply by 100, and you land at 55.1%. That's a solid number for most full-service formats, and it took less time to calculate than a single lunch rush.
What's a Healthy Prime Cost Benchmark for Your Format?
There's no single right answer here, because a quick-service counter and a steak house are playing different financial games entirely.
Rough target bands by format:
- Quick service and fast casual: roughly 55% to 60%, thanks to lower labor intensity and simpler menus
- Full-service casual dining: roughly 60% to 65%, reflecting table service and more complex kitchens
- Fine dining: can run higher, up to around 68%, since labor-heavy service and premium ingredients both push the number up
- Beverage-led concepts (bars, breweries): often lower on the food side but can spike on labor during high-volume shifts, so the blended target still tends to land in the 55% to 62% range
You've probably heard of the 30/30/30 rule: roughly 30% food, 30% labor, 30% overhead, leaving about 10% profit. It's a useful gut check, but treat it as a sanity check, not a prescriptive target. A tasting-menu concept with two servers per ten covers will never hit a 30% labor number, and forcing it there would gut the guest experience that justifies the price point.
The real question isn't "am I exactly at benchmark," it's "how far off, and why." If your prime cost sits more than five points above your format's band for several weeks running, that's usually not a fixable-this-shift problem. It's a structural issue: your menu pricing, staffing model, or portion sizes need a redesign, not a pep talk.
Why Prime Cost Drives Your Profit More Than Any Other Number
A single percentage point of prime cost translates directly into real dollars, and the swing is bigger than most owners assume. Depending on your revenue and location, each point of improvement can be worth a significant amount annually depending on location and revenue in additional profit, because prime cost sits above almost every other controllable expense on your P&L.
The trickier part is the trade-off baked into the number. Cut labor too aggressively and service slows, ticket times climb, and food waste rises because there's no one watching the line closely enough. Cut food cost too aggressively and portions shrink or quality drops, and you lose repeat guests. Prime cost is useful precisely because it captures the net effect of both moves at once. It won't let you claim a win on labor while food quietly erodes the same margin.
That's also why prime cost works best as a leading indicator rather than a lagging one. A monthly P&L tells you what already happened. A weekly prime cost calculation tells you what's happening now, while you still have time to fix it before the month closes.
How Do You Actually Lower Prime Cost?
Most meaningful prime cost improvement doesn't come from one dramatic cut. It comes from several small, compounding wins across food and labor that add up faster than owners expect.
Food cost levers:
- Update recipe costing every time a vendor price shifts, not once a year
- Enforce portion control with standardized tools (scales, scoops, portion cups) at every station
- Keep a waste log that captures what's thrown out and why
- Rebid vendor contracts annually, and compare at least two suppliers on your top ten cost items
- Run spot inventories on high-cost items weekly rather than waiting for the monthly count
- Track actual-versus-theoretical (AvT) variance and treat anything above 2% as a signal to investigate portioning, waste, or theft
AvT variance deserves special attention because it's where most food-cost problems hide in plain sight. Theoretical cost tells you what your menu should cost based on recipes. Actual cost tells you what you really spent. The gap between them exposes waste, over-portioning, and shrinkage that a simple food-cost percentage will never reveal on its own.
Labor cost levers:
- Schedule to sales bands using hourly forecast data, not last week's schedule copied forward
- Cross-train staff so you can flex coverage without overstaffing every station
- Set overtime alerts before a shift, not after the payroll run
- Build burden ratios into every labor budget from day one, not as an afterthought
- Right-size management and support roles against actual volume, especially during shoulder seasons
Operational enablers that make all of this faster:
- POS-to-inventory integrations that pull sales data automatically instead of manual counts
- Invoice automation that captures vendor pricing in real time
- A recurring menu engineering review that reprices or redesigns items with poor margin contribution
- Weekly spot checks that catch drift before it becomes a monthly surprise
Pro Tip: Run your AvT variance check on your top five volume items first. That's usually where 80% of your leakage hides, and fixing those five items moves your prime cost faster than a full menu audit.
For a deeper look at where food waste specifically erodes margin, restaurant waste reduction tactics can tighten the food half of this equation without touching labor at all.
What Should You Track Weekly, and When Do You Escalate?
Prime cost only functions as a management tool if you run it on a schedule, not when the P&L makes you nervous.
- Pull three data sources every week: point-of-sale sales totals, purchase invoices for the period, and the payroll export. The GM and chef should review these together, not separately.
- Calculate AvT variance and compare it to your 2% target. Anything higher means recipes, portioning, or waste need attention before the next inventory cycle.
- Track a four-week rolling average, not just the single week's number. One good or bad week rarely tells you much; the trend does.
- Apply the one-week spike rule: investigate anything more than 1.5 points off your rolling average, since that gap almost always points to a specific, findable cause.
- Triage by which half moved. If food cost spiked, check AvT variance and recent recipe changes first. If labor spiked, check the schedule against actual sales volume and look for uncontrolled overtime.
This cadence is what separates operators who catch problems in week one from operators who discover them on the monthly P&L, three or four weeks too late to do anything but wince.
What Does a Practitioner's Prime Cost Checklist Look Like?
Every Monday, before anything else, pull three numbers: last week's sales, COGS, and burdened labor. Compare the resulting prime cost to your four-week rolling average in one line. If it moved more than 1.5 points, you already know where to look first.
Wits' End Solutions runs prime cost turnarounds the same way every time, because the sequence works:
- Diagnose: Pull four to eight weeks of sales, COGS, and payroll data to find where the drift actually lives, food or labor.
- Stabilize: Fix the highest-leverage issue first, usually AvT variance or a scheduling mismatch against sales bands.
- Embed: Hand the weekly cadence back to the GM and chef with clear triage rules, so the improvement holds after the engagement ends.
Payroll burden calculations get considerably easier when your insurance reporting is automated alongside it. Payroll report integration with your workers' comp carrier removes one more manual step from a process that already has too many.
What Should You Do This Week?
Run this week's prime cost today. Spot-count your top three cost items tomorrow. Adjust next week's schedule to match your actual sales bands, not last week's habit.
- Set a 90-day target: most operators running more than five points above their format band can realistically pull two to three points back within a quarter
- Assign one owner for food tracking and one for labor tracking, even if it's the same person wearing two hats
- If prime cost hasn't moved after 60 days of consistent effort, that's the signal to bring in outside help or a dedicated task force
The Real Problem Isn't the Math
Every operator I've reviewed knows the prime cost formula. The failure point is almost never calculation, it's cadence. Owners run the number once a month, get a bad surprise, panic-cut hours for two weeks, and watch the same problem resurface by month three because nothing structural changed.
The conventional advice treats prime cost as an accounting exercise: get the formula right, check it against a benchmark, move on. That undersells what the number is actually for. Prime cost is a triage tool. Its entire value is in catching drift early enough to fix it with a small correction instead of a painful one.
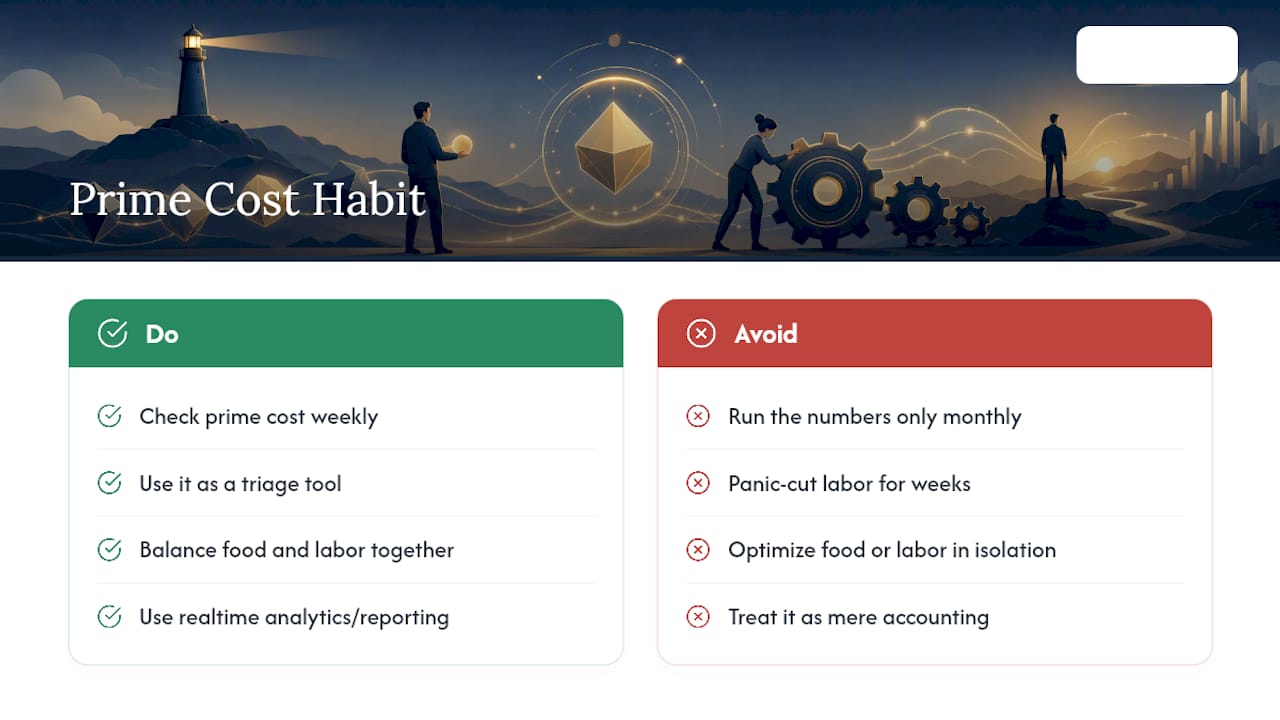
What gets overlooked most: the food-labor trade-off. Operators optimize one side in isolation, cut labor hours, then wonder why food waste crept up because there weren't enough hands to portion correctly during the rush. Prime cost forces you to see both halves together, which is exactly why it's more useful than food cost percentage or labor percentage alone.
If you take one thing from this, make it the weekly habit before the formula. The math is the easy part.
— Chris
For readers who want to see where prime cost fits against your full financial picture, a restaurant P&L walkthrough shows exactly where this number lands relative to rent, marketing, and overhead. Operators looking for ongoing visibility into these numbers, rather than a once-a-month scramble, can explore deep analytics and reporting built specifically to track prime cost and the KPIs around it in real time. For concepts already running well above their format band, a task force engagement is often the faster path to stabilizing the number before it does more damage to the P&L.
Sources
- Restaurant Prime Cost: Targets and Weekly Math | FORCS
- Restaurant Prime Cost Accounting Explained
- Restaurant Prime Cost: The Only Number That Matters