
Target 12 to 15 square feet per seat for fast-casual concepts, 15 to 18 for full-service, and 18 to 22 for fine dining, then cap daily operations at roughly 70 to 85% of your code-calculated occupant load. That gap between the legal ceiling and the operating number exists on purpose. It protects the aisle space, server timing, and table turns that actually drive revenue per hour.
Three things control that number: how much of your floor plan is truly usable after subtracting kitchen and restroom zones, how wide your aisles and egress paths need to be, and how your table mix matches your real party-size distribution. Get those right before you touch a chair.
Do this first:
- Measure gross and net dining area separately, excluding service zones
- Mark every aisle and route on a scaled floor plan before adding a single table
- Run the occupant-load math using your actual table-and-chair configuration
Key Takeaways
Dining room capacity planning works when operators calculate the legal occupant load first, then deliberately target 70 to 85% of it with a table mix matched to real party-size data.
| Point | Details |
|---|---|
| Calculate before designing | Use 15 sq ft per person for table seating and 7 sq ft for chair-only zones to find your legal ceiling. |
| Operate below the ceiling | Target 70 to 85% of code occupant load daily to protect aisle space and turn times. |
| Match table mix to demand | Aim for roughly 60% two-tops and 30% four-tops, adjusted to your reservation history. |
| Test before committing | Run a two-night comparison tracking covers per hour, turn time, and average check before locking in a change. |
| Get a full audit | Wits' End Solutions runs capacity audits, layout design, and analytics to validate changes with real service data. |
Table of Contents
- How to Calculate Dining Room Capacity Planning Correctly
- What Clearances Actually Cost You in Usable Space
- Which Table Sizes Fit Your Guest Mix Best
- Which Staffing and Reservation Tactics Raise Capacity Without New Seats
- How to Test Whether Your Capacity Changes Actually Worked
- A Field-Ready Capacity Audit Checklist
- Where to Place Service Stations and Set Run-Distance Limits
- How to Spot Peak Congestion Before It Happens
- How Reservation Systems Speed Up Table Turns
- Planning for Parties That Don't Fit Your Standard Tables
- How Layout Shapes the Guest Experience
- Adjusting Seating Capacity for Different Times and Events
- What Most Capacity Advice Gets Wrong
- Get Hands-On Help Turning This Into a Working Floor Plan
- Sources
How to Calculate Dining Room Capacity Planning Correctly
Start with net area, not gross square footage. Subtract the kitchen, restrooms, host stand, corridors, and any mechanical shafts from the total dining room footprint. What's left is your net usable area, and it's almost always smaller than owners expect. A lot of first-time operators plan against the lease square footage and end up over-promising covers to their own investors.
Apply the standard occupant-load factors from fire and building code: table-and-chair seating uses 15 square feet per person, chair-only seating (banquet rows, lecture-style) uses 7 square feet, and standing or bar areas typically run 5 to 7 square feet depending on your local code. Divide net area by the applicable factor, and if your room mixes uses, calculate each zone separately, then add them together.
- Measure net dining area (gross minus kitchen, restrooms, corridors)
- Divide net area by 15 square feet (table service) or 7 square feet (chair-only)
- Sum the results if your floor plan mixes seating types
- Treat that number as your legal ceiling, never your target
That worked example gives a legal occupant load of 113.
What Clearances Actually Cost You in Usable Space
Code minimums aren't suggestions, and they eat more square footage than most floor plans account for. A primary aisle needs a minimum of 36 inches, and egress corridors run 28 to 36 inches depending on the occupant load feeding into them. Chair-back spacing, the gap between a seated guest's chair and the next obstruction, needs 18 to 24 inches so servers can pass without turning sideways.
ADA requirements add their own layer: a minimum 36-inch accessible route, a 30 by 48 inch clear floor space at every accessible table, and a small portion of your dining surfaces built to that standard. Skip this step during design and you'll retrofit it later at a much higher cost.
- Primary aisles: at least three feet wide, no exceptions
- Egress paths: 28 to 36 inches based on occupant load served
- Chair-back clearance: 18 to 24 inches for server passage
- Accessible route: 36 inches, with 5% of tables meeting the 30×48 inch clear-floor rule
Pro Tip: Add 6 to 12 inches beyond code minimums anywhere two servers might need to pass each other at once. That buffer costs you almost nothing in seats but saves real time during a full-house Saturday.
Map every corridor on your plan before placing a single table, then subtract that footprint from net usable area. Skipping this step is the single most common reason a floor plan looks great on paper and falls apart during actual service.
Which Table Sizes Fit Your Guest Mix Best
That mix gives you flexibility to combine tables for larger parties without leaving seats empty on a slow Tuesday when solo diners and couples dominate the floor.
Layout pattern matters as much as table count. A grid of two-tops and four-tops on 24 to 30-inch centers works well for high-volume casual concepts where density drives revenue per square foot. Perimeter booths and banquettes trade some flexibility for comfort and built-in storage, and they read as more private, which matters for full-service and fine dining concepts where guests linger longer. Communal tables work for beer halls, food-hall concepts, or private events, but they demand wider aisle access on both sides and a service model built around shared seating.
- Two-top/four-top grids: best density, easiest to reconfigure, least private
- Booths and banquettes: higher comfort, lower flexibility, better for check averages that reward dwell time
- Communal tables: strong for events and casual volume, weak for parties wanting privacy
Furniture choices reclaim inches you'd otherwise lose to bulky bases and armed chairs. Pedestal table bases free up leg room compared to four-leg designs. Benches seat more people per linear foot than individual chairs. Expandable tables let a two-top become a four-top for a walk-in party without a full reset. Small furniture swaps like armless chairs and slimmer table edges can add real seats without moving a wall, and keeping at least 36 inches of clearance between a table edge and the nearest wall or furniture piece preserves that passage even after the swap. Fixed booths look sharp and hold their spacing, but they lock you into one capacity number for every party size that walks in, which is exactly the tradeoff a good interior design partner should walk you through before construction, not after.
Which Staffing and Reservation Tactics Raise Capacity Without New Seats
You don't need to move a wall to seat more people well. Reservation cadence, station design, and menu structure move covers just as effectively as a layout change, and they cost nothing to test.
- Stagger reservation times instead of seating everyone on the hour; a 15-minute offset smooths kitchen ticket load and reduces the wait-list crunch at peak
- Set hold times and bump windows tied to your actual turn time, not an arbitrary 90-minute default
- Size server stations to roughly 40 to 50 seats per station, positioned to cap server-run distances rather than spread evenly across the room
- Deploy dedicated bussers during peak windows so servers stay on drinks, orders, and checks instead of clearing tables
- Run a limited peak-hour menu when ticket times threaten your turn target; fewer modifications means faster expo
Splitting service roles, one server on drinks and greetings, another on food and checks, cuts the steps any single server takes per table and speeds table turns without adding headcount. A well-designed operations workflow makes these role splits repeatable across shifts instead of improvised nightly.
Pro Tip: Watch your average check against your turn time together, not separately. A menu that pushes check average up but adds four minutes to ticket time can cost you more in lost turns than it gains in margin.
Reservation tools matter here too. A reservation setup that enforces realistic hold times prevents phantom no-shows from holding open tables during your busiest window.
How to Test Whether Your Capacity Changes Actually Worked
Run a two-night comparison before committing to a permanent layout or staffing change. Pick two matched weeknights, similar day of week, similar reservation volume, and run your current setup on one, the proposed change on the other.
- Track covers per hour, average check, and turn time from your POS turn reports for both nights
- Log seat utilization percentage, comparing seats filled against your operating target
- Time ticket duration from order to expo on a sample of tables each night
- Note qualitative friction: server complaints, guest wait times, any bottleneck at the pass or host stand
| KPI | What it tells you | Data source |
|---|---|---|
| Covers per hour | Whether the change increased actual throughput | POS turn reports |
| Turn time | How fast tables clear and reset | POS + timed observation |
| Seat utilization % | How close you're running to your operating target | Reservation + host log |
| Ticket time | Kitchen-to-table speed under the new setup | Kitchen display system |
If the numbers are close or ambiguous after two nights, extend the test rather than making a permanent call on thin data. When friction shows up in three or more categories at once, that's usually a sign to bring in deeper analytics rather than keep guessing shift to shift.
A Field-Ready Capacity Audit Checklist
You don't need a consultant on-site to run a first-pass audit. Walk the room with a tape measure and a floor plan, and work through this in an afternoon.
- Measure net dining area and subtract every non-usable zone
- Calculate legal occupant load using the correct factor per zone
- Pick your operating percentage (start at 75% if unsure) and your table mix
- Mark aisle widths and accessible routes directly on the plan
- Run a two-night test before locking in any permanent change
The biggest mistake we see isn't a bad floor plan. It's an operator who never measured the current one before deciding it needed to change.
Wits' End Solutions has walked this exact process with dozens of dining rooms, and the reservation system templates and daily operations guides referenced throughout this article come from that same playbook.
Where to Place Service Stations and Set Run-Distance Limits
Station placement decides whether your server-to-seat ratio actually works in practice. A station sized for 40 to 50 seats fails if it sits at the far end of the room from half those tables. Walk the actual path a server takes from station to farthest table, then time it. If that round trip regularly exceeds what a four-top order justifies, move the station or split it.
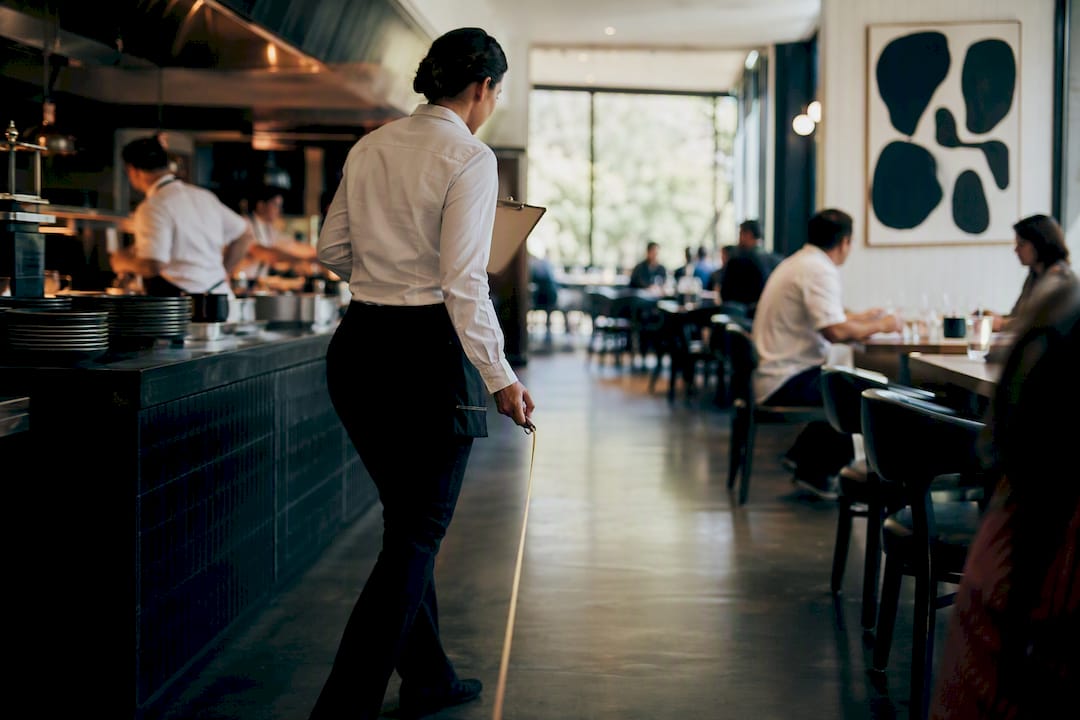
Kitchen-to-table run distance deserves the same scrutiny. Keep it under roughly 60 feet when your building layout allows it. Beyond that threshold, food temperature drops and server time gets eaten by travel instead of service. Installing a remote service station or pass-through near the far end of a long dining room protects both without any structural change to the kitchen itself.
Testing this doesn't require special software. Time ten consecutive server trips during a real dinner rush, from station to table and back, and average them. Compare that average against your target turn time. If server travel accounts for more than a small fraction of the total ticket cycle, you've found your bottleneck before it shows up in a bad Yelp review.
Watch the pass, too. A kitchen expo line that backs up isn't always a cooking problem. Sometimes it's servers waiting because the closest bus station is occupied, or two servers colliding at the same narrow aisle junction during a rush. Fixing that is often a five-minute conversation about where the tray stand sits, not a construction project.
How to Spot Peak Congestion Before It Happens
Guest flow bottlenecks show up in predictable places: the host stand during a wave of simultaneous arrivals, the server aisle nearest the kitchen door, and any pinch point where two paths cross, like a server route intersecting a guest path to the restroom.
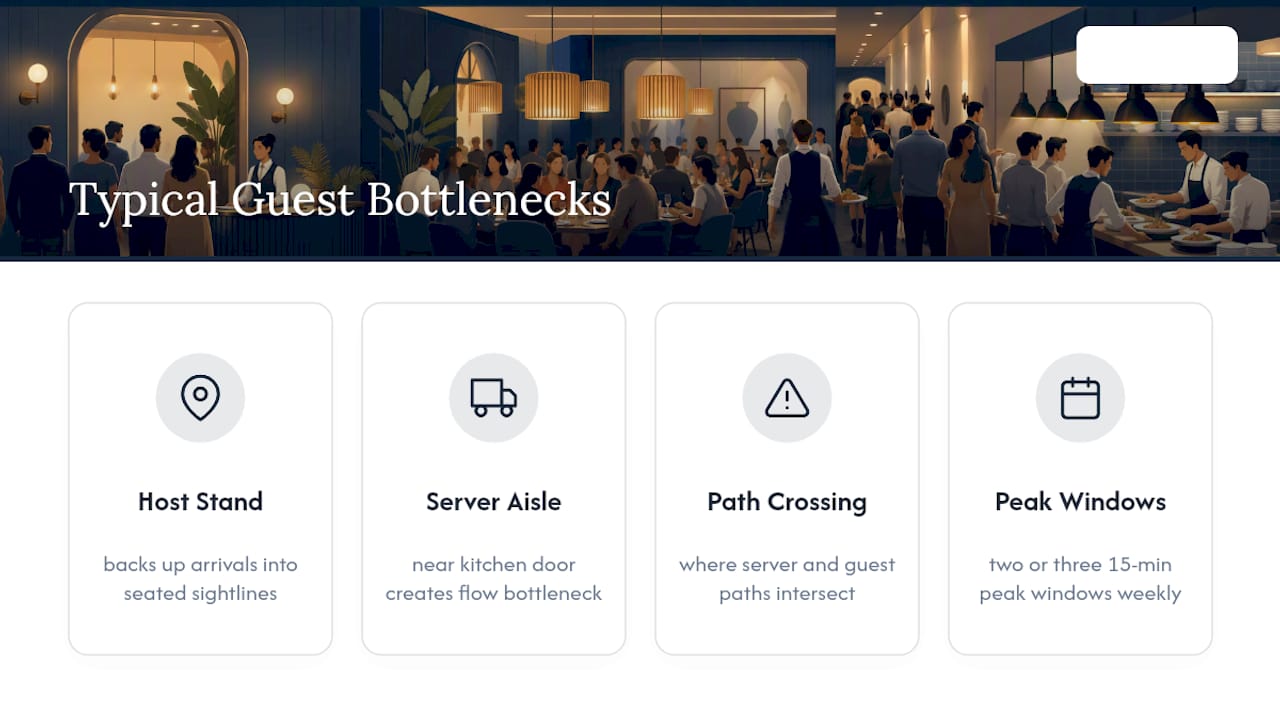
Walk your floor plan at your busiest hour and mark every point where paths cross or narrow. Those crossings are where congestion actually happens, not in the open dining area. A host stand positioned too close to a four-top can back up arriving parties into seated guests' sightlines, which hurts the guest experience even when the food and service are flawless.
Look at your reservation data by 15-minute block across a typical week. Most dining rooms see two or three genuine peak windows rather than one continuous rush, and each peak stresses a different part of the floor. A Friday dinner rush might load the bar and host stand simultaneously, while a Sunday brunch peak concentrates pressure on the coffee station and a single narrow service aisle.
Fixing a congestion point rarely means expanding the room. It usually means widening one aisle by a few inches, relocating a bus station, or shifting the host stand's sightline so incoming parties don't funnel through the busiest server path. Run this walk-through quarterly, since your peak patterns shift as your menu, hours, and guest base evolve.
How Reservation Systems Speed Up Table Turns
A reservation platform that talks directly to your floor plan does more than take bookings. It should assign parties to the right table size automatically, flag when a hold time is about to expire, and surface which sections are running behind before a host has to notice manually.
The gap between a basic reservation book and an integrated seating system shows up most during a rush. Without integration, a host is manually cross-checking a paper chart against incoming calls while guests wait at the door. With integration, the system flags an open four-top the moment it's bussed and ready, cutting the dead time between turn and reseat.
Set your system to track actual turn times against your target, not just reservation counts. If your target turn is 75 minutes and the data shows tables running 95, that gap is costing you real covers every single night, and it's visible in the reports if someone's actually pulling them.
Bump windows deserve the same discipline. A 15-minute grace period on a no-show reservation protects revenue better than holding a table indefinitely out of politeness. Configure that rule once, in the system, and it applies consistently across every shift instead of depending on whichever host is working that night.
Planning for Parties That Don't Fit Your Standard Tables
Your table mix handles two-tops, four-tops, and six-tops well. It's the party of three, the party of nine, and the solo diner at 7 p.m. on a Saturday that expose a rigid floor plan.
Movable furniture solves most of this. Two two-tops pushed together seat four without a dedicated four-top sitting empty during off-peak hours. A four-top with a folding leaf or a matching two-top nearby can flex to six for a birthday party without a full room reset. Keep a small number of your total tables genuinely combinable, not fixed booths, specifically for this purpose.
Large parties, eight or more, need advance planning regardless of your table mix. Decide in advance which section of the room absorbs them and whether that section requires pulling tables from elsewhere, since every large party you seat ad hoc during a rush usually costs you two or three smaller-party turns in that same section.
Solo diners are worth a specific plan too, particularly at a bar or counter section if you have one. Seating a party of one at a four-top during a packed Friday wastes three seats of capacity you can't recover. A few counter or bar seats reserved conceptually for single diners keeps your table inventory free for the parties that actually fill it.
How Layout Shapes the Guest Experience
Spacing decisions aren't just a code compliance exercise. They shape whether a table feels private enough for a business dinner or a first date, and that perception affects dwell time, repeat visits, and word of mouth just as much as the food does.
Tight two-top grids maximize density but sacrifice acoustic and visual privacy. Guests notice when they can hear the table next to them clearly, and that noise level shapes review language more than most operators expect. Booths and banquettes solve this by design, offering a sense of enclosure that a freestanding two-top in an open room can't replicate at the same density.
Sightlines matter as much as spacing. A table facing directly into the kitchen pass or a busy host stand reads differently than one angled toward a window or a quieter wall. Small adjustments, angling a table 15 degrees, adding a low partition, repositioning a light fixture, change the felt privacy of a seat without changing its square footage. This is exactly the kind of detail a guest experience design review catches that a pure capacity spreadsheet misses.
Adjusting Seating Capacity for Different Times and Events
Your dining room doesn't need to run at one fixed capacity all day. Lunch service might support a denser, faster-turning layout, while dinner calls for slightly more spacing and a slower pace that matches a higher average check.
Modular furniture makes this practical. Stackable chairs, folding tables, and rolling partitions let a room reconfigure between a brunch layout and a private event setup in under an hour, without a full remodel. Some operators combine dining and event space intentionally, treating the same square footage as a revenue lever across multiple dayparts rather than a fixed asset.
Special events call for their own occupant-load math, not an assumption that your standard dining capacity applies. A private buy-out with standing cocktail service uses a different load factor than seated dinner service, and mixing the two in the same event requires calculating each zone separately, then summing them, the same method covered earlier for mixed-use rooms.
Build a simple seasonal or weekly capacity calendar: standard service, private event configuration, and any holiday-driven layout that adds temporary seating in a bar or waiting area. Reviewing that calendar quarterly against actual booking patterns keeps your capacity plan matched to demand instead of locked to whatever the original build-out assumed.
What Most Capacity Advice Gets Wrong
Most capacity guidance treats the code occupant load as a target to hit rather than a ceiling to respect. That's backward, and it's the single most expensive mistake I see in floor plans that look great on paper and fail on a Friday night. The room that seats to code every single service is usually the room where server run times balloon, turn times slip, and revenue per hour quietly drops even as the seat count climbs.
The conventional fix, add more seats, is almost always the wrong lever. The better fix is usually a table-mix adjustment or a station redesign that raises throughput at the same seat count. Operators fixate on the number of chairs in the room when the real constraint is how fast a server can move between them.
Test before you commit. A two-night comparison costs you almost nothing and tells you more than a consultant's floor plan sketch ever will, because it measures your actual guests, your actual staff, and your actual kitchen speed. Start there, not with a tape measure and a wish list of new tables.
— Chris
Get Hands-On Help Turning This Into a Working Floor Plan
Reading the math is one thing. Walking your actual dining room with someone who's run this exact audit across dozens of properties is another. Wits' End Solutions builds capacity plans, table mixes, and station layouts as part of full operational engagements, not as a one-time consulting deliverable you're left to implement alone.
Where a lot of operators get stuck is the gap between the calculation and the construction decision, choosing furniture, working with a contractor, and validating the plan against actual service data once it's built. Wits' End Solutions covers that full arc, from interior design and layout support through the analytics that confirm whether the new floor plan actually moved covers and revenue per hour.
If your dining room needs a capacity review before your next menu launch or a seasonal reset, start a conversation with Wits' End Solutions about what a full audit and layout engagement would look like for your space.
Sources
- ADA / IBC comparison — Chapter 9
- Restaurant floor plan & seating capacity: revenue per square foot | Smart Restaurant Owner